A diverse funding portfolio supports Sandia’s multimission work.
Sandia’s budget includes operations, equipment, construction
| Budget | FY25 |
|---|---|
| Operating | $5,603.2 million |
| Capital equipment | $78.5 million |
| Construction | $85.8 million |
| Total labs funding | $5,767.5 million |
| Note: Sandia's fiscal year (FY) runs from October 1 through September 30 of following year. | |
DOE and non-DOE funding was $5,767.5 million in FY 2025
| Funding by source | FY25 |
|---|---|
| NNSA | |
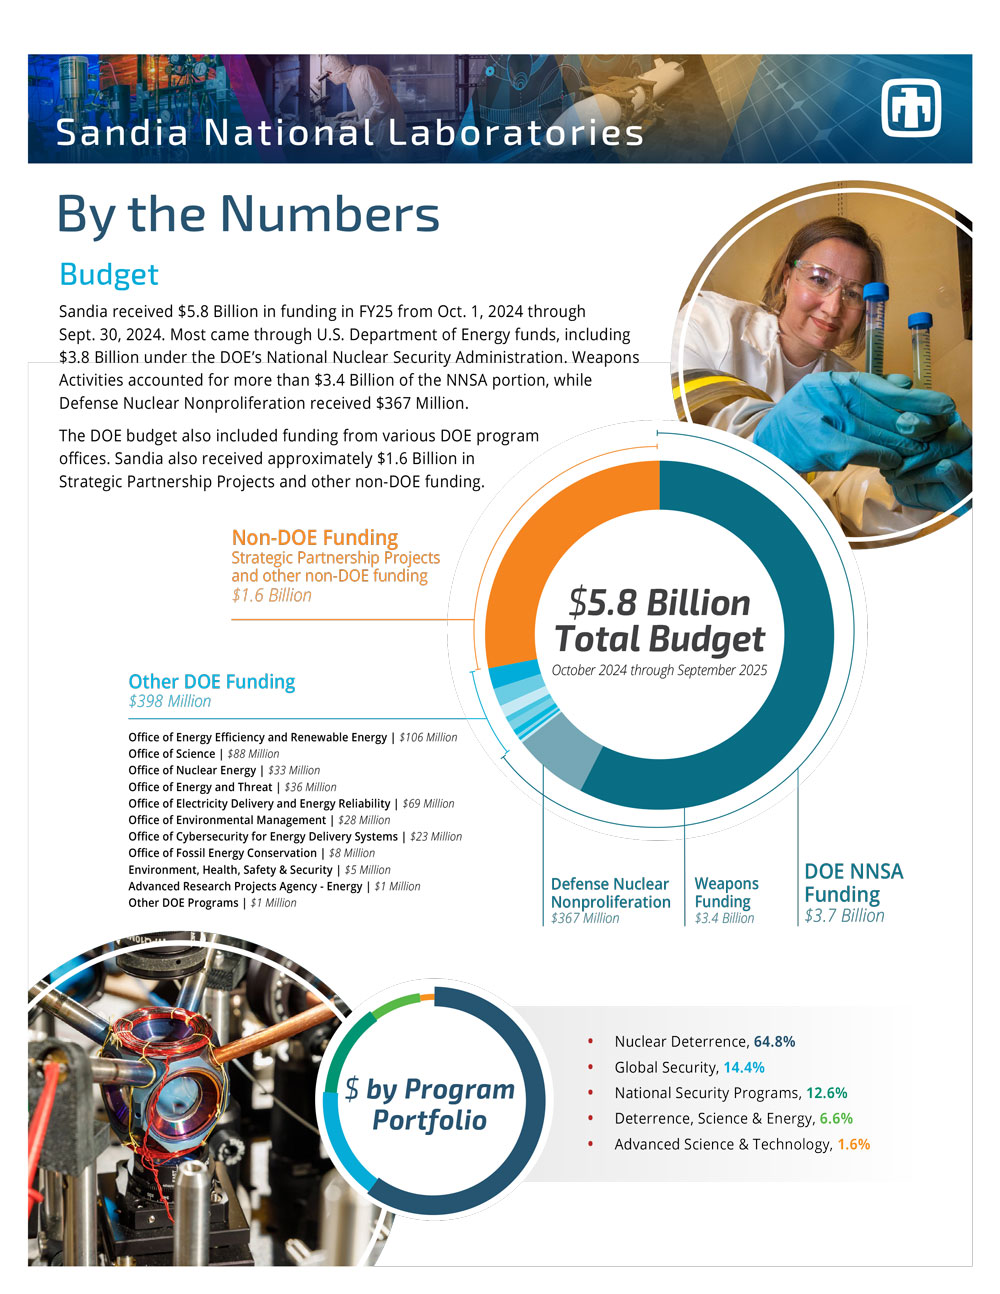
| Weapons activities | $3,403 million |
| Defense nuclear nonproliferation | $367.1 million |
| Total NNSA | $3,770.1 million |
| Non-NNSA DOE | |
| Electricity delivery & energy reliability | $69.3 million |
| Cybersecurity for energy delivery systems | $22.7 million |
| Energy efficiency & renewable energy | $106 million |
| Energy & threat | $36 million |
| Environmental management | $28.1 million |
| Fossil energy | $7.6 million |
| Nuclear energy | $32.7 million |
| Science | $87.9 million |
| Other DOE | $7.2 million |
| Total non-NNSA DOE | $397.5 million |
| Total DOE funding | $4,167.6 million |
| Strategic Partnership Projects (work for others) | |
| DoD | $1,359.8 million |
| DHS | $62.2 million |
| Other federal agencies | $86.1 million |
| Non-federal entities | $51.1 million |
| CRADAs & licenses/royalties | $10.9 million |
| Inter-Entity Work | $29.8 million |
| Total SPP | $1,599.9 million |
| Total Sandia revenue | $5,767.5 million |
| Funding by program portfolio | |
| Nuclear Deterrence (ND) | $3,739.5 million (64.8%) |
| Global Security (GS) | $831 million (14.4%) |
| National Security Programs (NSP) | $725.7 million (12.6%) |
| Deterrence, Science & Energy (DSE) | $378.9 million (6.6%) |
| Advanced Science & Technology (AS&T) | $92.4 million (1.6%) |
| Total lab funding | $5,767.5 million |
Sandia employs more than 16,300*
| Workforce | FY25 |
|---|---|
| Regular employees | 13,998 |
| Limited term | 893 |
| Students | 1,036 |
| Post-docs | 376 |
|
Faculty/recurrents |
Less than 20 |
| Total employees* | 16,320 |
| Total workforce** | 16,350 |
| * This figure shows full-time equivalents (FTEs) for regular and limited-term employees, students, post-doctoral fellows and faculty for all sites on Sept. 30, 2025; figure does not include staff augmentation contractors. | |
| ** Totals may vary slightly due to rounding. A full-time equivalent is defined as one regular employee on roll for a full fiscal year. | |
Regular employees have earned more than 13,998 degrees
| Associate | BA/BS | MA/MS | PhD | Other degree | |
|---|---|---|---|---|---|
| Number of regular employees | 920 | 3,138 | 5,265 | 2,275 | 2,400 |
| Total degrees | 13,998 |
Sandia acreage, structures and site populations
Sandia operates in Albuquerque, N.M.; Livermore, Calif.; Tonopah Test Range, Nev.; and Kauai Test Facility and Maui, Hawaii; and has leased space at other locations, including a Washington, D.C., office.
| Acres of land mass | Number of buildings & trailers | Number other structures & facilities | Gross square footage | Site population* | |
|---|---|---|---|---|---|
| Albuquerque, NM Site | 13,734 | 718 | 86 | 6,330,936 | 12,915 |
| Livermore, CA Site | 407 | 100 | 47 | 992,925 | 1,744 |
| Tonopah Test Range, NV | 3,520 | 81 | 49 | 117,818 | 40 |
| Kauai Test Facility, Hawaii | 120 | 46 | 44 | 44,404 | 8 |
| Leased space at all other locations | 2,707 | 17 | 2 | 391,553 | 1,613 |
| Permits (primarily Kirtland AFB) | - | 100 | 2 | 230,594 | - |
| Totals | 20,488 | 1,062 | 230 | 8,108,230 | 16,320 |
| *Full-time equivalents includes limited-term employees, students and post-docs. | |||||
Related Links

For more information on Sandia’s people, locations and funding, visit the Fact Sheets library: