High performance computing is effective at studying systems whose behavior is governed by phenomena over a broad range of scales, complex and intricately coupled physics, or both. In an automotive internal combustion engine, the turbulent flow in the combustion chamber comprises scales ranging from the piston’s size to about four orders of magnitude smaller. At the same time, the coupling between fluid dynamics, liquid fuel spray breakup and evaporation, turbulent mixing of fuel vapor with ambient air, and chemical kinetics driving the ignition and flame propagation all have a bearing on important operational aspects such as power, efficiency, timing, and stability of the engine cycle.
Given such complexity, small and localized events in these systems can have large consequences — the proverbial butterfly effect. In engines, the inception of the initial ignition kernels is critical to how the combustion and exhaust cycles ensue. These ignition kernels are small, localized events and many factors such as fuel thermo chemistry, fuel injection timing and placement, operating conditions like temperature and pressure, and device geometry are precisely tailored to achieve a certain ignition behavior. Identifying these ignition kernels — how they initiate, when and where they occur, and how they transition to flames — is critical to understanding the overall behavior of an internal combustion engine and avoiding undesirable effects, such as flame quenching and engine knock.
For decades, experiments have been — and still are — crucial to studying engines to improve their efficiency and emissions characteristics. However, experiments have limits in terms of what can be observed or measured. Numerical simulations are an alternative, but they either use simplified models for various physics or low-fidelity methods to be computationally feasible for engineering-scale systems. Only with the advent of exascale computing has it become possible to approach device-scale, high-fidelity simulations of internal combustion engines.
The Exascale Computing Project accelerated the development of HPC applications in a broad set of scientific disciplines, including combustion, to achieve exascale capability. The simulations performed were at an unprecedented scale, studying systems and phenomena not previously attempted and generating vast amounts of data in the process. Analyzing and processing data at such scales and gleaning scientific insight pose special challenges. For engine combustion simulations, one challenge is identifying the ignition kernels as and when they occur, and tracking their evolution for downstream analyses. Since they are small localized events, they are difficult to predict by their very nature, yet crucial to identify and follow.
Collaborating across three different projects, a team of Sandia researchers demonstrated a novel methodology for quickly and precisely identifying ignition events in situ within exascale combustion simulations. Posing the problem as one of identifying anomalous or rare events in high-dimensional systems with a large number of degrees of freedom, the methodology works by analyzing fourth-order joint moments (co-kurtosis) of thermochemical variables, such as temperature, pressure, and species concentrations. It is grounded in multi-variate statistics and exploits the principle that a signature of rare events is more pronounced in the higher-order joint moments of solution variables. In so doing, the methodology dispenses with specifics of a particular problem and provides a principled approach that is applicable to a broad class of problems.
This overcomes one of the main difficulties with existing techniques for identifying ignition events, which use ad hoc criteria and thresholds that are problem-specific and do not generalize for different fuels or operating conditions.
The methodology is multi-tiered. The first tier identifies spatial sub-domains of interest by assigning an anomaly metric to each sub-domain. This aligns well with domain-decomposed parallel HPC simulations. The second tier computes a metric for each individual sample — gridpoint/cell — identifying those that constitute an ignition event. The method has been shown to be very robust, with a high accuracy rate and a low rate of mis-identification.
Beyond the ad hoc techniques, there are more principled approaches for identifying ignition events that examine higher-order chemical quantities. However, these are computationally very expensive; computing the higher-order chemical entities is typically an order of magnitude more expensive than a simulation timestep. This makes them impractical for in situ deployment, since the additional cost of performing the analysis overwhelms the simulation cost.
In contrast, the co-kurtosis method is computationally efficient, adding only marginal cost (less than 5%) to that of the simulation. Most importantly, the methodology has excellent parallel efficiency, which is crucial for exascale performance. The methodology achieves parallel efficiency by ensuring that most of its computations operate on data local to each processor, requiring only minimal communication. A low ratio of local computation-to-communication is what degrades parallel efficiency.
The methodology was applied to a high-fidelity direct numerical simulation of four pre-vaporized n-dodecane jets injected into an engine cylinder with a methane-air mixture. The effort achieved an Exascale Comuting Project joint milestone involving three projects: ExaLearn, for exascale machine learning; PELE, for combustion; and ALPINE, for scalable frameworks for in situ analysis.
The simulation, comprising 2.4 trillion degrees of freedom, was performed with the PeleC combustion code on the 7,100 compute nodes — a total of 56,800 GPUs — of Frontier at the Oak Ridge Leadership Computing Facility.
The co-kurtosis methodology was implemented in the tensor decomposition software library GenTen under the ExaLearn Project. Its deployment in situ was enabled by Ascent, the in situ analysis and visualization software infrastructure developed under ALPINE.
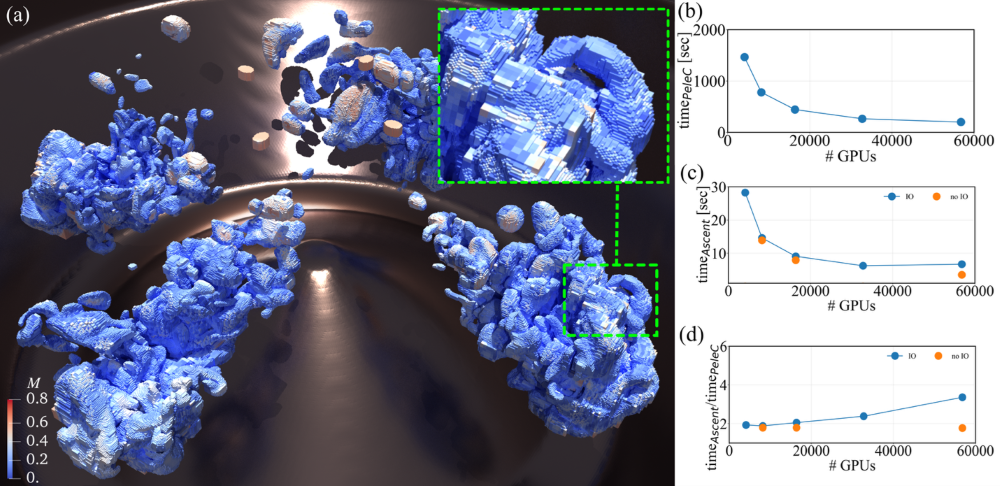
Figure 1a shows a visualization of the simulation sub-domains, or grid blocks, colored by the anomaly metric from the co-kurtosis methodology. Note that each grid block shown in this figure contains up to 643 gridpoints/cells. The computational scalability and performance of the method is also shown; Figures 1b and 1c show the time taken for performing one timestep by PeleC and performing the co-kurtosis computation, respectively, at different number of GPUs on Frontier. Their ratio, plotted as a percentage in Figure 1d, shows that the co-kurtosis methodology takes less than 5% of the simulation time at all scales. This collaboration showcases broader efforts, which went beyond developing exascale-ready application software to establishing a broad exascale computing ecosystem that included many critical enabling technologies.