As permafrost thaws, it exposes ancient organic matter that microbes can use as fuel. This process contributes to the release of gases like carbon dioxide, methane (CH₄) and volatile organic compounds (VOCs). In areas like the Yedoma permafrost, which holds large amounts of frozen organic material, the formation of thermokarst caused by melting ice can lead to significant increases in CH₄ emissions. Microbes living below the surface are believed to play a key role in breaking down this organic matter, but scientists still need better tools to understand how microbial activity below ground influences these emissions.
To help answer these questions, Sandia researchers studied four Arctic sites: two raised mounds formed by melting ice, a drained thermokarst lake, and the area next to a newly formed thermokarst lake. Their goals were to determine if they could effectively collect biogenic VOCs during winter, and if winter samples could be used to understand microbially-relevant VOCs in the absence of summertime plant growth.
In March 2023, Sandia researchers drilled boreholes at these sites and collected samples to analyze both microbial populations and their VOCs. Their analysis revealed unique “fingerprints” of VOCs at each site, identifying more than 400 distinct VOC features, including over 40 that might come from microbial activity. The types of microbes varied by site; for example, methane-producing microbes, known as methanogenic archaea, were especially common at the thermokarst site with high methane emissions.
These findings suggest that about 10 percent of the VOCs are likely created by microbes. By identifying these biogenic VOCs and linking them to specific microbial processes, this research provides a new way to monitor and predict carbon cycling in Arctic soils as these ecosystems continue to warm.
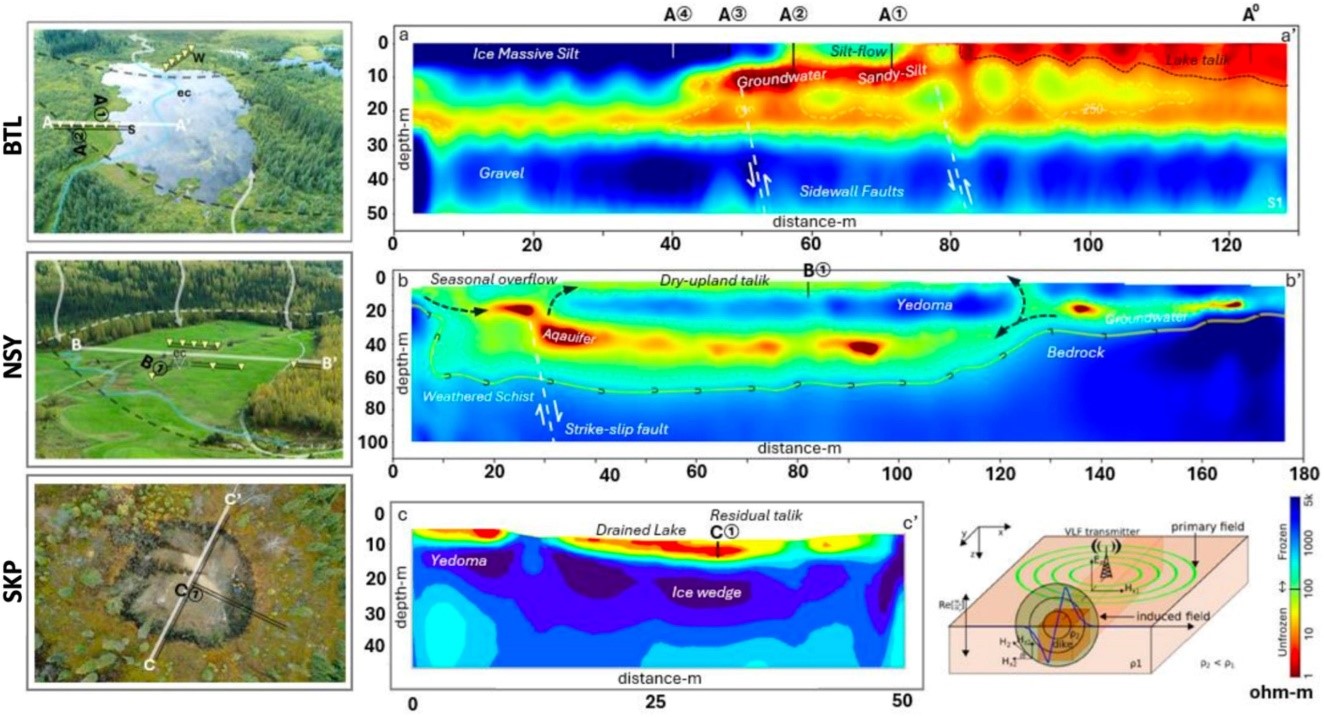
Geophysical resistivity surveys using very long frequency-magnetotelluric (VLF-MT) methods created 2D models of thermokarst (TK) at three locations: Big Trail Lake (BTL), NorthStar Yedoma (NSY), and Skidmore Pond (SKP). Each site is shown from above, with models indicating the presence of permafrost. Color-contour plots highlight frozen permafrost in blue and unfrozen areas in yellow to red.
The 2D electrical resistivity (ER) profiles, supported by borehole data from transects (A-A’, B-B’, C-C’), show permafrost where resistivity is above 100 ohm-m, indicating thawed conditions or talik. Dark red areas (less than 1 ohm-m) represent groundwater.
In the BTL model, the south (A) and north (A’) transects show measurements from flux sites (A1, A2, A3, A4) and the nearby Eddy-covariance tower (A0). The NSY model displays the east (B) and west (B’) transects, highlighting core site B1, while the SKP model shows the north (C) and south (C’) transects, indicating core site C1.
Sandia researchers linked to work
- Chuck R. Smallwood
- Jihoon Yang
- Jenna Schambach
- Haley Bennett
- Bryce Ricken
- Jason Sammon
- Monica Mascarenas
- Naomi Eberling
- Stephanie Kolker
- Joshua Whiting
- Wittney D. Mays
- Philip R. Miller
Sponsored by
Bioscience Investment Area Lab Directed Research and Development
Associated Publications
Smallwood, C. R., Hasson, N., Yang, J., Schambach, J., Bennett, H., Ricken, B., Sammon, J., Mascarenas, M., Eberling, N., Kolker, S., Whiting, J., Mays, W. D., Walter Anthony, K., & Miller, P. R. (2025). Bioindicator “fingerprints” of methane-emitting thermokarst features in Alaskan soils. Frontiers in Microbiology, 15, Article 1462941. https://doi.org/10.3389/fmicb.2024.1462941
June 2, 2025