Sandia partnerships map shows impact across the US
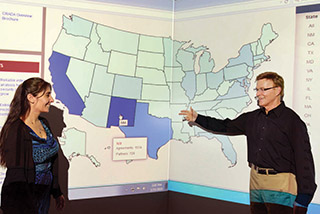
Pete Atherton, senior manager of Industry Partnerships Dept. 1930, goes over New Mexico information on the Partnerships National Reach Map with software developer Lozanne Chavez (1931). The map shows the numbers and types of Sandia partnership agreements across the country. To view the interactive map online, click on the image above. (Photo by Randy Montoya)
Sandia signed more than 5,000 US partnership agreements in the past five years touching every state in the country, and has created an online map that brings them to life.
“The map illustrates the amazing breadth of work Sandia does with industrial, university, government, and lab partners around the United States,” says Pete Atherton, senior manager of Industry Partnerships Dept. 1930.
The Partnerships National Reach map has been in development for three years. Pete says it came about because many people inside and outside Sandia didn’t know the extent of the Labs’ collaborations. “People often ask how many industrial partners we work with and when I ask them to guess, I hear 20, 30, 40. Actually, in 2014 we worked with 830 unique industrial partners,” he says. “The map takes it further to other types of partnerships. We wanted to tell the full Sandia story. This shows how much collaboration and technology transfer is really going on, and it doesn’t include the Labs’ many global partners. That would be an even bigger picture.”
The map includes Cooperative Research and Development Agreements, Government Use Notices, technology licenses, Non-Federal Entity Funds-In agreements, the New Mexico Small Business Assistance program, and the University Partnerships program. It is on Sandia’s website and interactively displays the number of agreements and partners in each state as the mouse hovers above it. Filters include partner type, fiscal year, and agreement type. “Our trusted partnerships limit the amount of information we display, like a company name,” Pete says. “But there are many neat examples described in videos and documents accessible on the left side of the web page.”
Lozanne Chavez (1931) led the software team that developed the map. “A lot of effort went into the data gathering and cleanup,” she says. “We pulled from five different data sources.” She says the site will be updated yearly to provide a current snapshot of Sandia’s partnerships.
Pete says he hopes the map will contribute to data-informed decision making by business people, economic developers, and policymakers. He says people can see the breadth of partnerships and build on them.
“With partnerships in every state, Sandia further demonstrates that we are a national lab in every sense,” says Andy McIlroy, director of Research Strategy & Partnerships Dept. 1900 and deputy chief technology officer. “This tells a compelling story of technology transfer.”
Patricia Knighten, manager of the Office of Science and Technology at the state Economic Development Department, says the map is a useful tool that shows how a national lab can contribute to economic development. “This is great work, not just the website, but the partnerships,” she says.
Here are some key figures from the map. The data includes fiscal years 2010-2014.
All partner types
- Total agreements: 5,080
- New Mexico: 1,574
- California: 560
- Texas: 341
Industrial partners
- Total agreements: 2,534
- New Mexico: 1,150
- California: 275
- Texas: 103
University partners
- Total agreements: 1,796
- New Mexico: 324
- Texas: 226
- California: 174