Background
The Monticello Mill Tailings Site is located in southeastern Utah, south of the town of Monticello (see image to the right). The present climate at Monticello is sub-humid, with an average annual precipitation of ~38 cm (15 inches) and an average annual temperature of 7.8 C (46 F). In 1941, the Monticello mill was constructed and used to process nearly a billion kilograms of ore. By 1960, when operations were terminated, approximately 2 million cubic meters of radioactive uranium mill tailings had been left behind from the operations. To contain the mill tailings, DOE began construction of a repository south of the original mill site in 1995, and in 1996 the construction of a composite double- liner system at the base of the repository was completed.
The cover was designed to mitigate the release of radon gas to the surface and to minimize water infiltration to the mill tailings. It consists of a thick topsoil layer with vegetation that can store precipitation and allow evaporation and transpiration via vegetation. This top layer overlies a coarse sand layer that acts as a capillary barrier and is intended to drain any infiltrating water laterally above a high-density polyethylene geomembrane. Beneath the geomembrane is a compacted clay layer that serves as a barrier to radon gas transport and water infiltration. The clay layer rests directly on top of the mill tailings. At the base of the repository beneath the mill tailings is a double composite-liner system composed of sand, two geomembrane liners, two geosynthetic clay-liners, and a transmissive leachate collection system. The entire repository is surrounded by Quaternary deposits consisting of sandy loam, clay, and pediment gravels.
Beneath the repository, two aquifers exist–a perched alluvial aquifer, as close as several meters below the bottom of the repository and the regional Burro Canyon aquifer beneath the alluvial aquifer. The perched aquifer was contaminated by mill tailings prior to construction of the repository. The contaminants of concern include uranium, as well as its radioactive decay products (thorium-230, radium-226, radon-222), and heavy metals such as vanadium, lead-210, and arsenic. The Burro Canyon aquifer and has not been contaminated. Between the alluvial aquifer and the Burro Canyon aquifer are unsaturated layers of shale and sandstone. The water from the upper alluvial aquifer is used for irrigation purposes, but all drinking-water wells are located in the lower Burro Canyon aquifer.
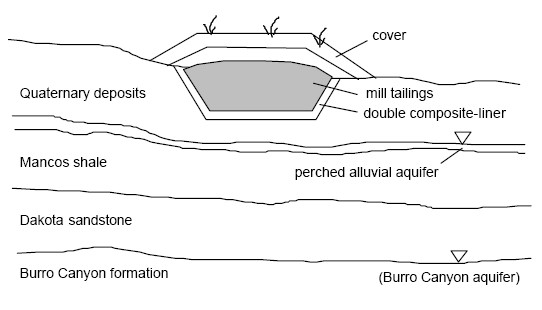 |
| Monticello landfill cover and surrounding geology |
Objectives
The metrics and objectives used for the process assessment of the Monticello Mill Tailings Repository case study are as follows:
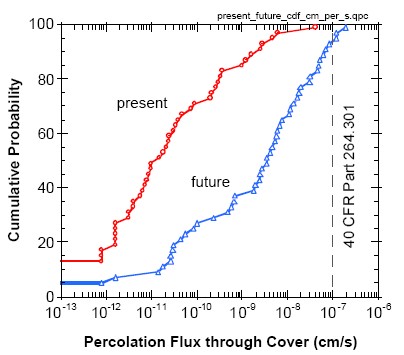
- Percolation of water reaching mill tailings shall be less than 1×10⁻⁷ cm/s. This is based on the prescribed maximum conductivity of the clay liner, where a unit- gradient flow is assumed to equate percolation to conductivity.
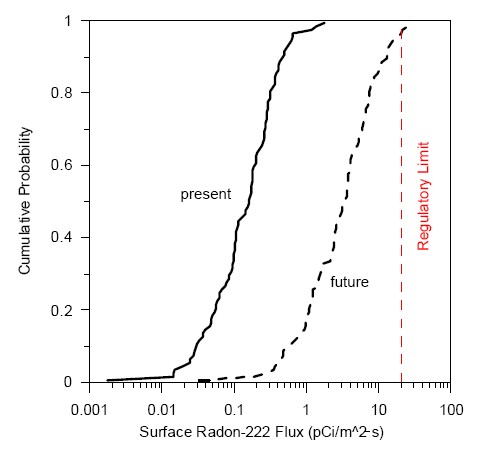
- Average flux of radon-222 gas shall be less than 20 pCi/m2/s at the surface of the repository cover.
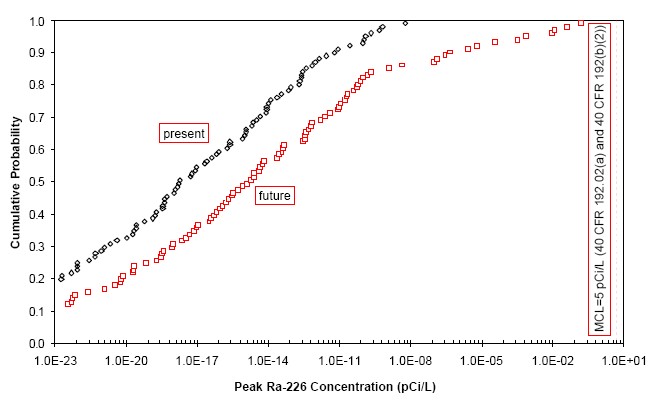
- Combined radium-226 and radium-228 concentrations in groundwater shall be less than 5 pCi/L (only radium-226 is evaluated in this study).
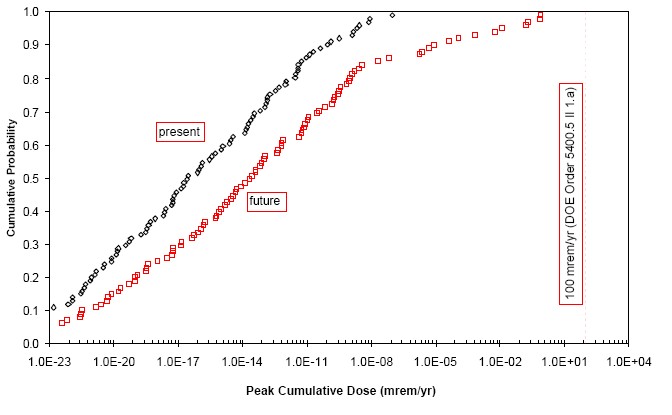
- The effective dose to a member of the public from all pathways shall be less than 100 mrem/year (only radium-226 is evaluated in this study).
Scenarios
The first step in the performance assessment is to develop relevant scenarios based on performance objectives and applicable features, events, and processes at the site. For a list of features, events, and processes at the site refer to section 4.1 of SAND Report 2002-3131: Development of a Risk-Based Probabilistic Performance-Assessment Method for Long-Term Cover Systems–2nd Edition (Full reference).
A total of eight scenarios were chosen for this study:
| Scenario | Description | Climate | Performance Objective Addressed |
| 1 | Infiltration percolates through the cover and reaches the mill tailings. | Present | Percolation of water reaching mill tailings shall be less than 1×10⁻⁷ cm/s. |
| 2 | Infiltration percolates through the cover and reaches the mill tailings. | Future | Percolation of water reaching mill tailings shall be less than 1×10⁻⁷ cm/s. |
| 3 | Radon-222 gas diffuses from the mill tailings to the surface. | Present | Average flux of radon-222 gas shall be less than 20 pCi/m2/s at the surface of the repository cover. |
| 4 | Radon-222 gas diffuses from the mill tailings to the surface. | Future | Average flux of radon-222 gas shall be less than 20 pCi/m2/s at the surface of the repository cover. |
| 5 | Radium-226 leaches from the mill tailings and transports through the composite liner, the vadose zone, and into the shallow alluvial aquifer where water is used for agricultural purposes. | Present |
|
| 6 | Radium-226 leaches from the mill tailings and transports through the composite liner, the vadose zone, and into the shallow alluvial aquifer where water is used for agricultural purposes. | Future |
|
| 7 | Radium-226 leaches from the mill tailings and transports through the composite liner, the vadose zone, and into the deep Burrow Canyon aquifer where water is used for agricultural purposes and drinking. | Present |
|
| 8 | Radium-226 leaches from the mill tailings and transports through the composite liner, the vadose zone, and into the deep Burrow Canyon aquifer where water is used for agricultural purposes and drinking. | Future |
|
Conceptual Models
Once the scenarios were developed, conceptual models of the features, events, and processes for each scenario could be formulated. The conceptual models include contaminant source and release information, a description of transport mechanisms and pathways, and a definition of modeling endpoints.
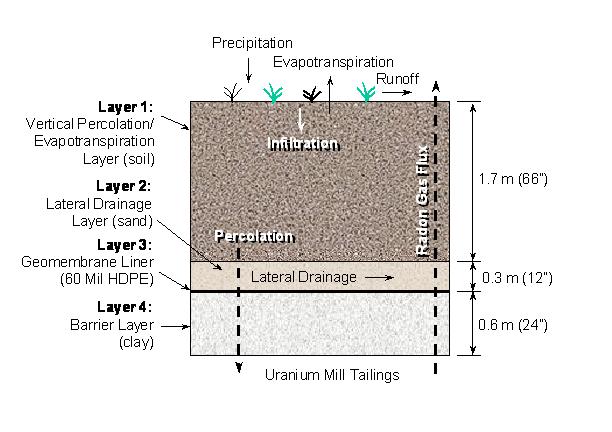
| The figure below shows the conceptual model for water percolation (scenarios 1 and 2) and gas transport (scenarios 3 and 4) through a composite (base-case) cover design for present and future conditions. A 3% slope is assumed for the drainage layer. |
 |
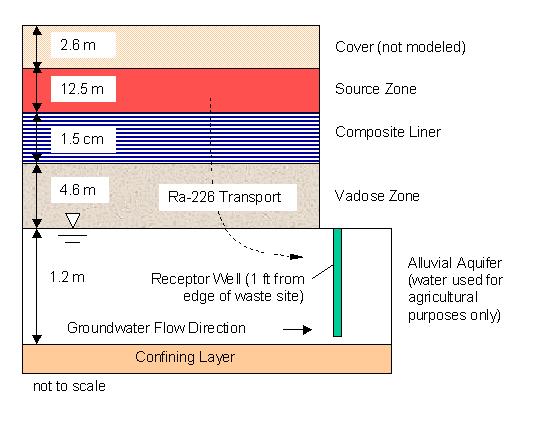
| The figure below shows the conceptual model for radionuclide transport from the mill tailings to the shallow alluvial aquifer and location of receptor well for present (scenario 5) and future (scenario 6)conditions. |
 |
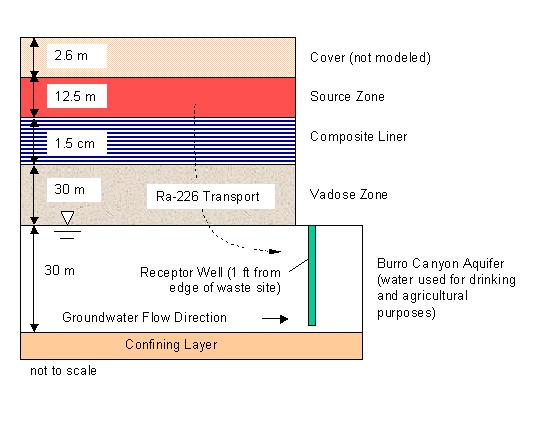
| The figure below shows the conceptual model for radionuclide transport from the mill tailings to the deep Burro Canyon aquifer and location of receptor well for present (scenario 7) and future (scenario 8) conditions. |
 |
Total-System Framework Models
The system used for this study was the Framework for Risk Analysis in Multimedia Environmental Systems (FRAMES). FRAMES was developed by Pacific Northwest National Laboratory (PNNL) with funding from DOE and EPA. The FRAMES system provides a user-friendly platform for integrating medium specific computer models, an extensive and editable contaminant database, a powerful and flexible sensitivity/uncertainty module, and textual and graphical viewers for presenting modeling outputs.scenarios 1 and 2 were simulated separately using HELP v. 3.07 as a stand-alone code (Schroeder et al., 1994). As part of this project, HELP was integrated into FRAMES so that stochastic HELP simulations could be performed from within the FRAMES architecture.
Parameter Distribution for Process Models
Six process models, each with necessary input parameter distributions, were included in the total-system model: (1) water percolation through the cover; (2) radon gas trasport through the cover; (3) source-term release; (4) vadose-zone transport; (5) saturated-zone transport; and (6) human exposure. For details on parameter distributions for each of the process models, refer to section 4.3 of SAND Report 2002-3131: Development of a Risk-Based Probabilistic Performance-Assessment Method for Long-Term Cover Systems–2nd Edition.
Results
Overall the results of this performance assessment illustrated how probabilistic analyses could be used to evaluate long-term performance of covers against regulatory metrics. The performance metrics can be risk-based, such as groundwater concentration or dose, or they can be prescriptive metrics such as conductivity for a particular layer of the cover. For detailed results, refer to section 4.4 of SAND Report 2002-3131: Development of a Risk-Based Probabilistic Performance-Assessment Method for Long-Term Cover Systems–2nd Edition. An example of the results follow.
| The following figure illustrates the cumulative probability distribution of water percolation reaching the mill tailings for present and future conditions (scenarios 1 and 2). |
 |
| The following figure illustrates the cumulative probability distribution of simulated radon flux at the land surface for present and future conditions (scenarios 3 and 4). |
 |
| The following figure illustrates the cumulative probability distribution for peak Ra-226 concentration in the shallow alluvial aquifer for present and future cond itions (scenarios 5-6). Note: concentration values of 0 are not plotted on the log scale. |
 |
| The following figure illustrates the cumulative probability distribution for peak cumulative dose for Ra-226 and its progeny from the shallow alluvial aquifer for present and future conditions (scenarios 5-6). Note: dose values of 0 are not plotted on the log scale. |
 |
Alternative Designs
An alternative cover design was also evaluated for the Monticello disposal site using probabilistic calculations. The performance of an evapotranspiration (ET) cover was evaluated using the same probabilistic methods described for the existing design. The ET cover consists of a simplified design consisting of only the top layer. The ET cover concept makes use of the natural moisture storage capacity of this upper layer of soil and the relatively high efficiency of natural vegetation for the removal of moisture via evapotranspiration. An assessment of landfill-cover cost versus performance can be made based on these results.
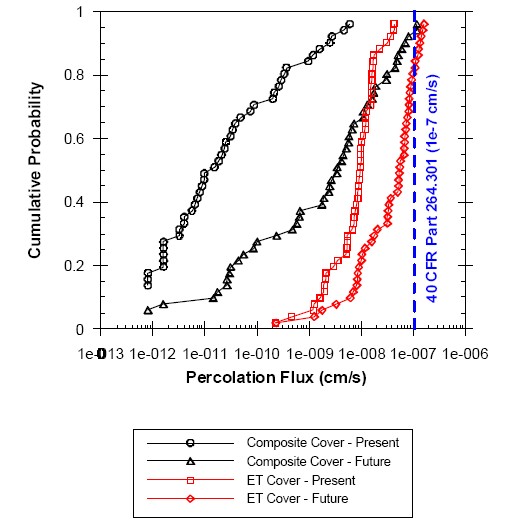
| The following figure illustrates the cumulative probability distribution of water percolation reaching the mill tailings for present and future conditions (scenarios 1 and 2) and for the evapotranspiration cover. Although the ET cover does not perform as well as the composite design with regard to percolation flux, the vast majority of the realizations for future conditions yield percolation flux values that are less than the regulatory limit. All of the realizations for present conditions simulate a value of percolation flux less than the regulatory limit. The expected behavior of the ET cover for future conditions is percolation lower than the regulatory limit. In addition, the ET cover is much cheaper to construct than similar designs such as the one at Monticello (Dwyer, 2000). |
 |
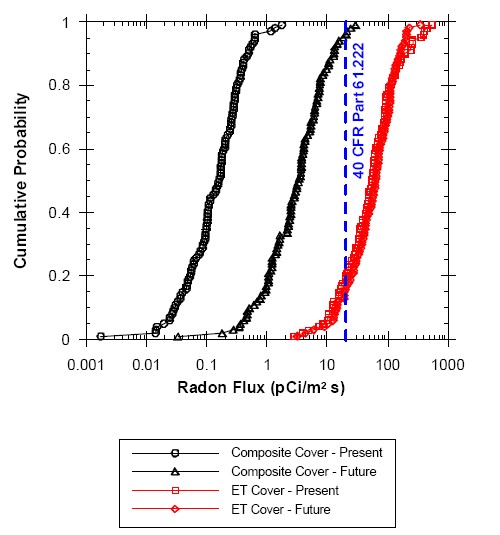
| However, simulated Rn-222 flux through the surface of the landfill cover is significantly higher for the ET cover relative to the composite cover, for both present and future conditions, as shown in the figure below. A majority of the realizations of the ET cover exceed the performance objective of 20 pCi/m2-s, for both present and future conditions. The 50th percentile values of the simulated Rn-222 flux are about 25 pCi/m2-s and 30 pCi/m2-s for present and future conditions, respectively. This result indicates an apparent violation of the regulatory limits for radon flux with the ET cover design. Thus, the ET cover design may be simplified, cheaper, and adequate for the performance metrics of percolation flux, groundwater concentrations, and cumulative dose, but inadequate to meet the radon flux standards. |
 |
For detailed results, refer to section 4.5 of SAND Report 2002-3131: Development of a Risk-Based Probabilistic Performance-Assessment Method for Long-Term Cover Systems–2nd Edition (Full reference).
Sensitivity Analysis
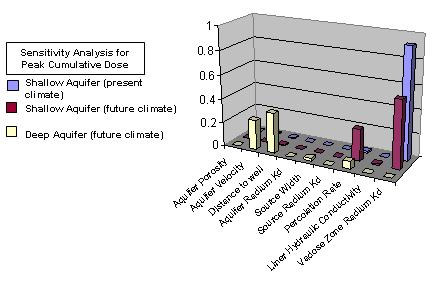
A sensitivity analysis of the probabilistic assessment results can provide valuable information regarding which components of the landfill cover system and which parameters are most important to the simulated performance metric(s). This information provides understanding about the relationship between uncertainty in individual input parameters and the uncertainty in the performance of the system. In addition, knowledge of the parameters having the greatest influence on future performance can be used to help prioritize site characterization activities, to help optimize landfill cover design, and to assist in the design of monitoring systems. Using a sensitivity analysis provides the quantitative information necessary to ensure that resources are directed to those aspects of the cover system that drive performance and not on those aspects of cover design that have little significance.
The following graph illustrates relative importance of stochastic input parameters on the simulated peak cumulative dose.
 |
Summary and Conclusions
Overall the results of this performance assessment illustrated how probabilistic analyses could be used to evaluate long-term performance of covers against regulatory metrics. The performance metrics can be risk-based, such as groundwater concentration or dose, or they can be prescriptive metrics such as conductivity for a particular layer of the cover. In both cases, probabilistic performance assessments can provide uncertainty and sensitivity analyses that identify the parameters that are most important to long-term performance. These parameters may be important for engineering design, environmental studies, and long-term monitoring efforts to assist in prioritizing their efforts. In addition, alternative designs for long-term covers can be evaluated using risk-based performance metrics that are intended to protect human health and the environment. These comparisons provide a more quantitative means to compare the performance of cover designs while factoring in additional issues such as cost and schedule.