Required Output/Results:
1.1 Description of Failure Prediction Model or Criteria Selected
1.2 Assumptions Made In Geometric Modeling, and Model Description
1.3 A subset of the response information defined by the “55 standard output locations” of the
1:4 Scale PCCV round-robin exercise; subset is to be determined later, but participants
should plan models accordingly. At a minimum, the displacement transducer/data plots
portion of the 55 Standard Output Locations are required.
1.4 Contour Plot of Peak Strains in the Liner During the LST at the pressure milestones:
P = 0 (prestress applied); 1 x Pd; 1.5 Pd; 2 Pd; 2.5 Pd; 3 Pd; 3.3 Pd; 3.4 Pd; Ultimate Pressure
1.5 A subset of the response information defined by the “55 standard output locations” of the
1:4 Scale PCCV round-robin exercise; see below for the specific list.
1.6 Contour Plots of Peak Strains in the Liner During the LST at the pressure milestones:
P = 0 (prestress applied); 1 x Pd; 1.5 Pd; 2 Pd; 2.5 Pd; 3 Pd; 3.3 Pd; 3.4 Pd; Ultimate Pressure.
1.7 1.7 Liner Strain Map of Entire Liner Surface; this has been discussed at the April 13-14
Meeting, and an Excel format for this is under development. But participants are asked to
plan for outputting this from their Model 4 Analysis. The “map” will have a location format
using the azimuths and elevations of the model as shown in Figure 13. It will not matter
how fine is the spacing of the data points, because participants model mesh sizes vary,
but participants are asked to plan for a minimum spacing for liner strain data of 450 mm,
which corresponds to the liner-anchor spacing.
For direct comparison amongst participants, please plot (Using Excel)
- Liner Strain Magnitudes (Hoop Direction) at Locations Indicated in Figure 11 (of SPE problem statement), versus pressure
- Tendon stress distribution at P = 0 (prestress applied); 1 x Pd; 1.5 Pd; 2 Pd; 2.5 Pd; 3 Pd; 3.3 Pd; 3.4 Pd; Ultimate Pressure for
- Hoop Tendons # H35, H53, H68
- Vertical Tendon # V37 and V46
- Plots of response versus pressure for Standard Output Locations: 1-15 (displacements); 22-29 (rebar strains); 36-42 (liner strains); 48-55 (tendon strains and stresses) (see Table 4-1 in NUREG/CR-6809 for exact locations and definitions of SOL’s)
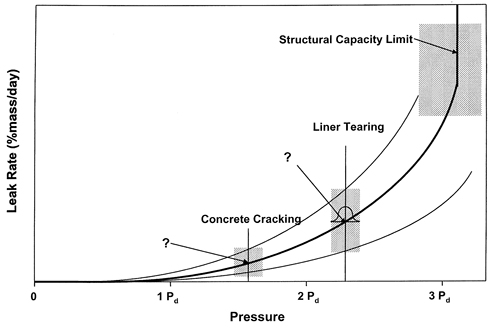
The second task of Phase 2 will be to transition the results of Model 4 into probabilistic space. The participants are requested to provide leak rate versus pressure curves for a suite of temperatures. An example of the desired output is shown below. The pressure range should vary from 0 to 4 times the design pressure. We look forward to the creative ways in which the SPE-3 participants will approach this last, all important, task for the SPE-3 project.