The DYMATICA computational modeling structure simulates interactions among populations, groups, and governmental organizations within selected country(ies) of interest (COI).
The DYMATICA structure and process is based on a specific combination of well-established psychological, social, and economic theories of decision making, as well as established techniques in knowledge elicitation, statistics, system dynamics modeling, uncertainty quantification, and sensitivity analysis. Data used to condition the model can originate from a large spectrum of sources including previous studies, subject matter expert (SME) guidance, reports, surveys, observations, and public media.
Focus of DYMATICA
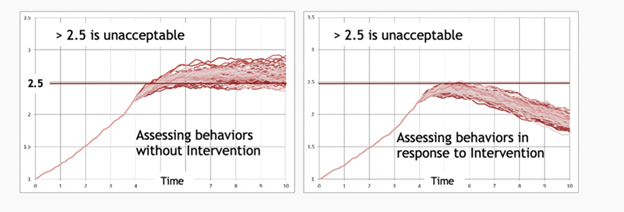
While DYMATICA cannot point-predict the exact timing or magnitude of specific state/non-state and population behaviors, it can indicate the range of likely behaviors across time and how a specific course of action (COA) can modify or strengthen the overall shape of behaviors.
For example, the figure below illustrates how a potential intervention can change the shape of behaviors so that it is more favorable over time. Here, each red line is a potential behavioral path, affected by various conditions. What is most important is the overall shape of the curve, consisting of the collective set of behavioral paths. Knowing the collective paths can provide a greater understanding of how to better address certain behaviors.
The Scientific Rigor Behind DYMATICA
DYMATICA uses a scientific and systems engineering approach to the modeling, simulation, and analysis of geopolitical events. The computer models instantiate the mathematics that represent empirically derived theories that reflect the reality of interest. Various validation techniques are used to determine and improve model accuracy, the efficacy of data inputs on model response, and intervention points with the greatest effect(s) on system results.
This process involves the identification and quantification of uncertainties associated with data/information pertaining to model parameters, such as government statistical and polling data, social media data, and SME guidance. Statistical methods are used to characterize data uncertainties. The formal analysis of the simulation results characterizes model confidence and robustness for “what-if” queries regarding various policies and actions.
Model confidence management procedures typically incorporate uncertainty quantification (UQ) and sensitivity analysis (SA), as well as other validation techniques. This involves ongoing, collaborative assessment to ensure that the final product provides useful information for the desired application. Uncertainty quantification is also used to learn how uncertainty in inputs ultimately propagates through the model to affect results. By simultaneously performing UQ for model parameters and potential interventions, the framework can determine the portfolio of interventions within a range of probabilities of success despite uncertainty. The risk associated with the intervention is also quantified.
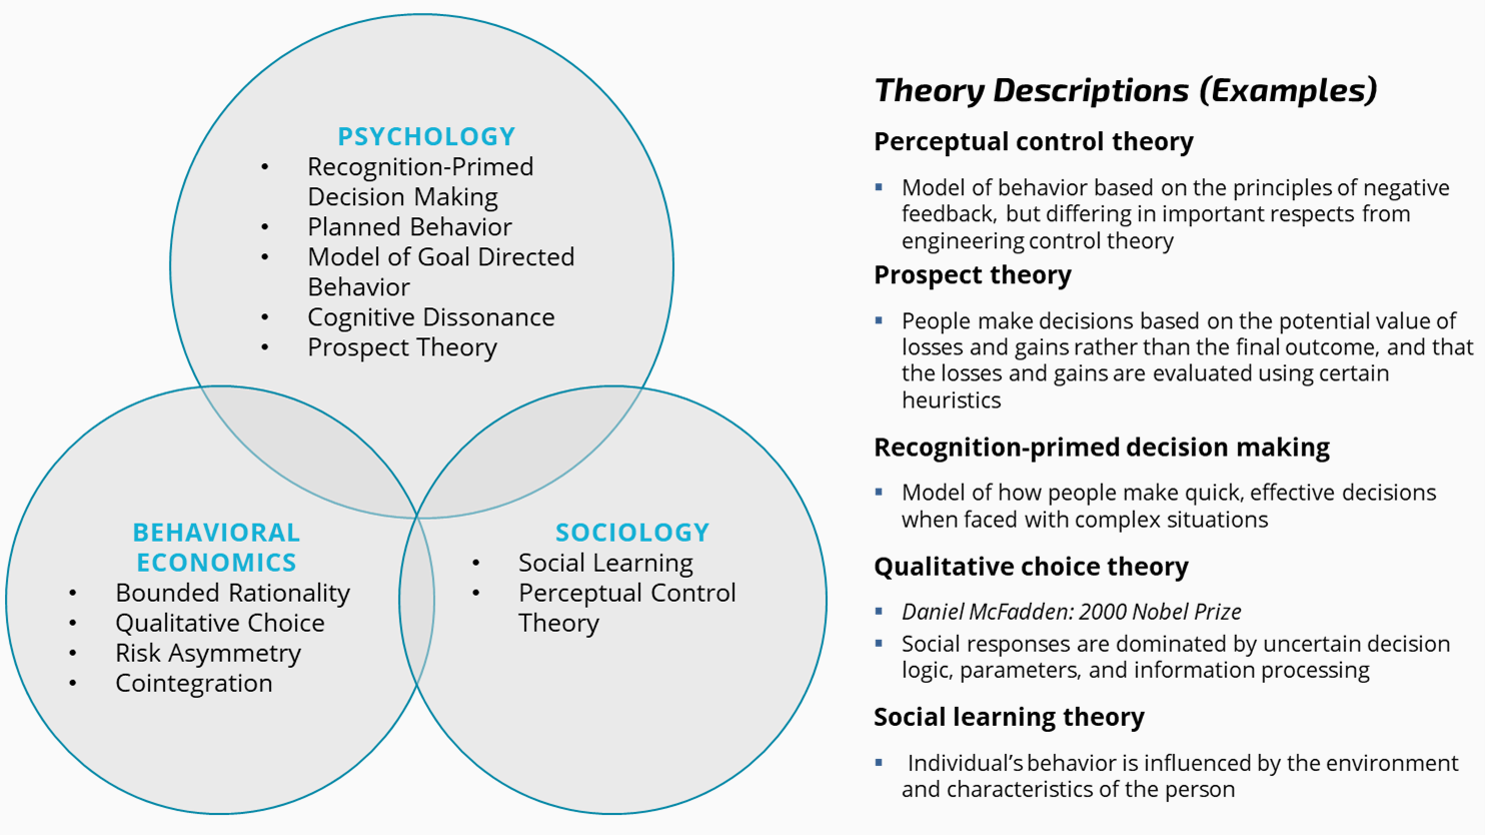
Major Theories Underlying DYMATICA
To address why a country or group of interest is doing what they are doing or how they would respond to a US or allied COA or policy, theories on how humans make decisions should be incorporated into any assessment.
DYMATICA is a theory-based computational model that incorporates empirically- based, well established theories on how individuals make decisions across multiple domains of interest. The figure below provides some of the theories that are incorporated within the DYMATICA framework.
The DYMATICA Modeling Process
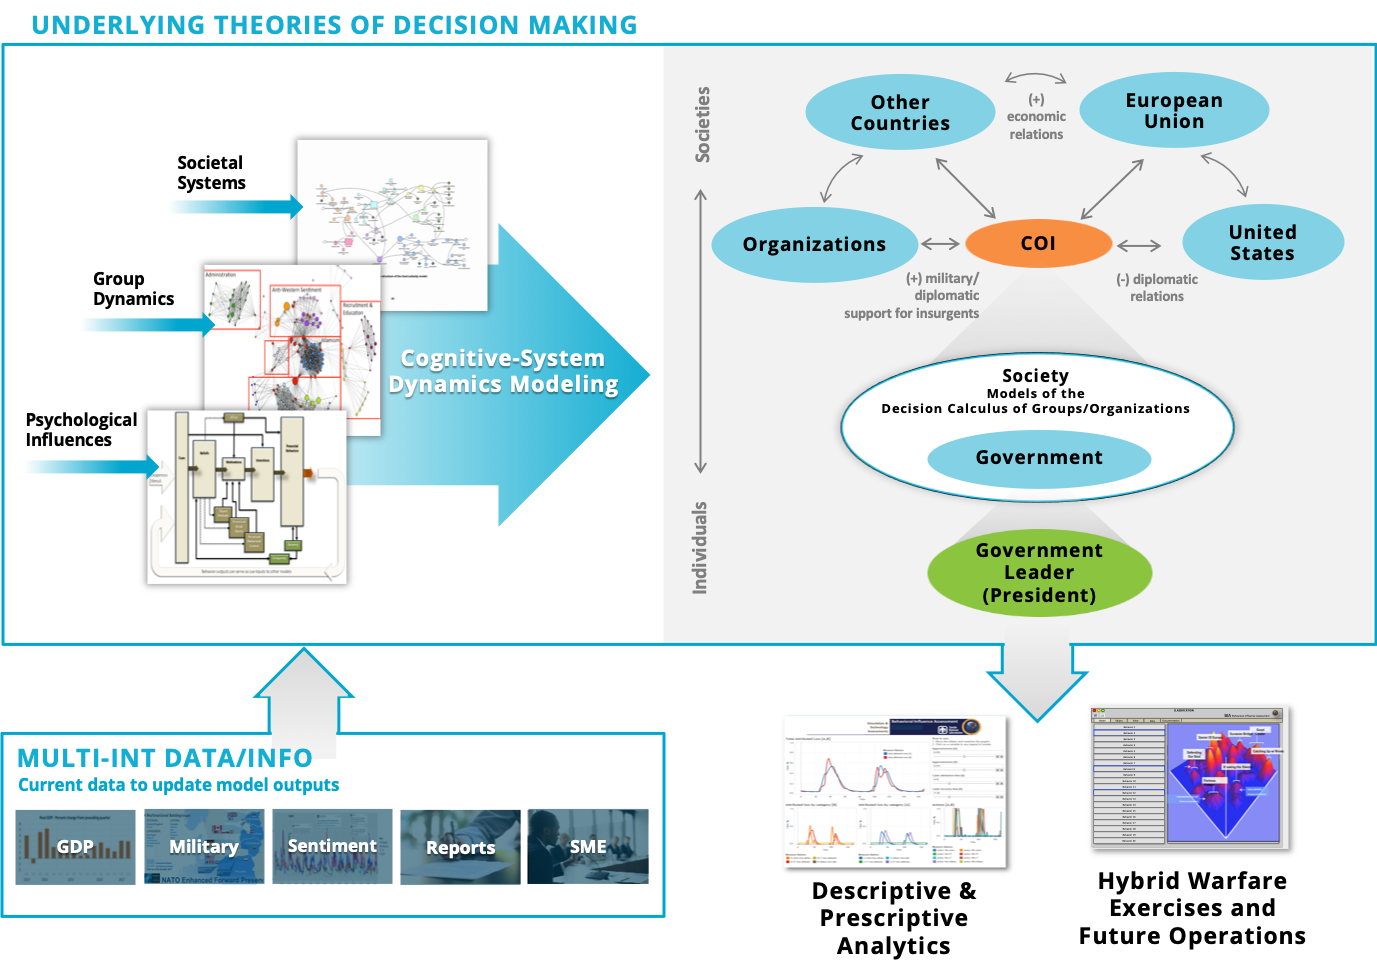
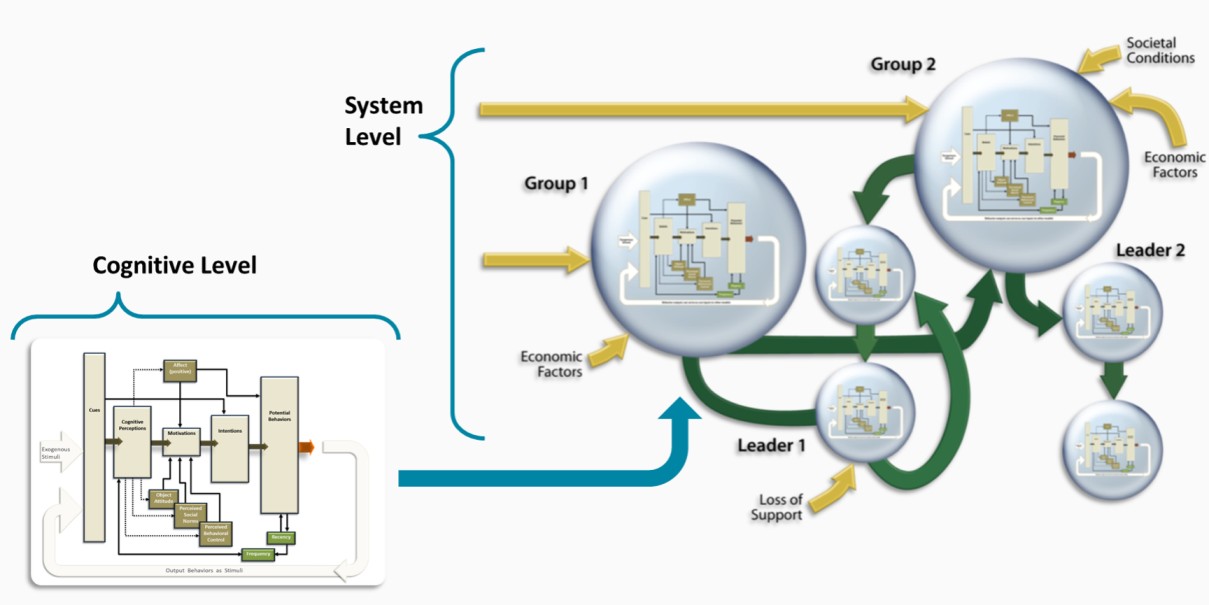
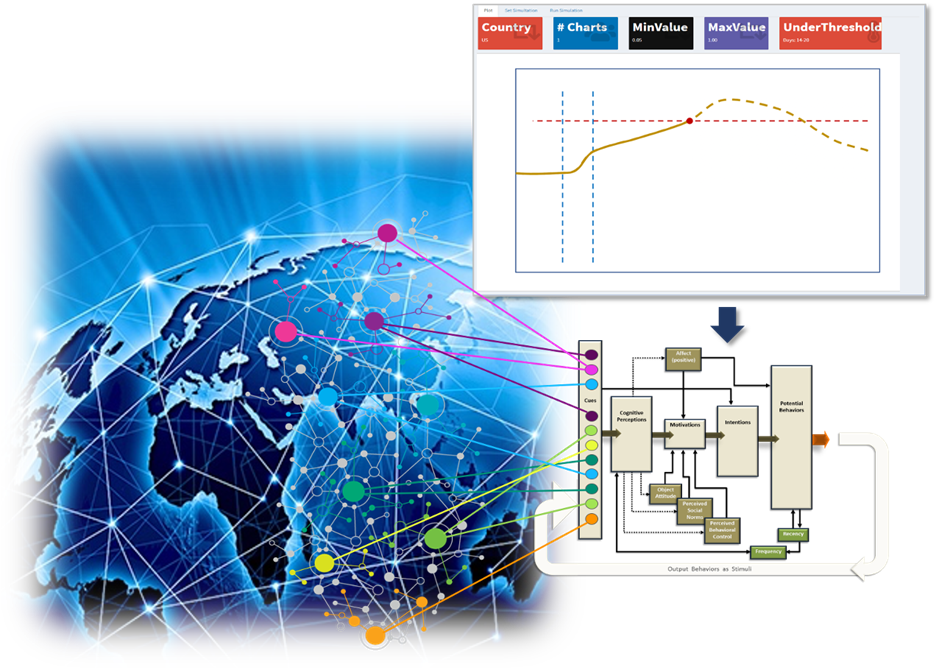
The DYMATICA structure consists of a modeling framework, model simulators, and an analysis approach. Each simulated behavior is a function of psychological characteristics along with environmental and group dynamic factors. This enables the assessment of group behaviors as the groups react to other’s perceptions and world conditions. As an illustration, the figure below shows a simplified conceptual representation of a hypothetical DYMATICA structure that involves the modeling of two interacting groups and several leaders. Exogenous inputs to the model (e.g., global economic factors and general population support) influence the dynamic interactions within and between the entities.
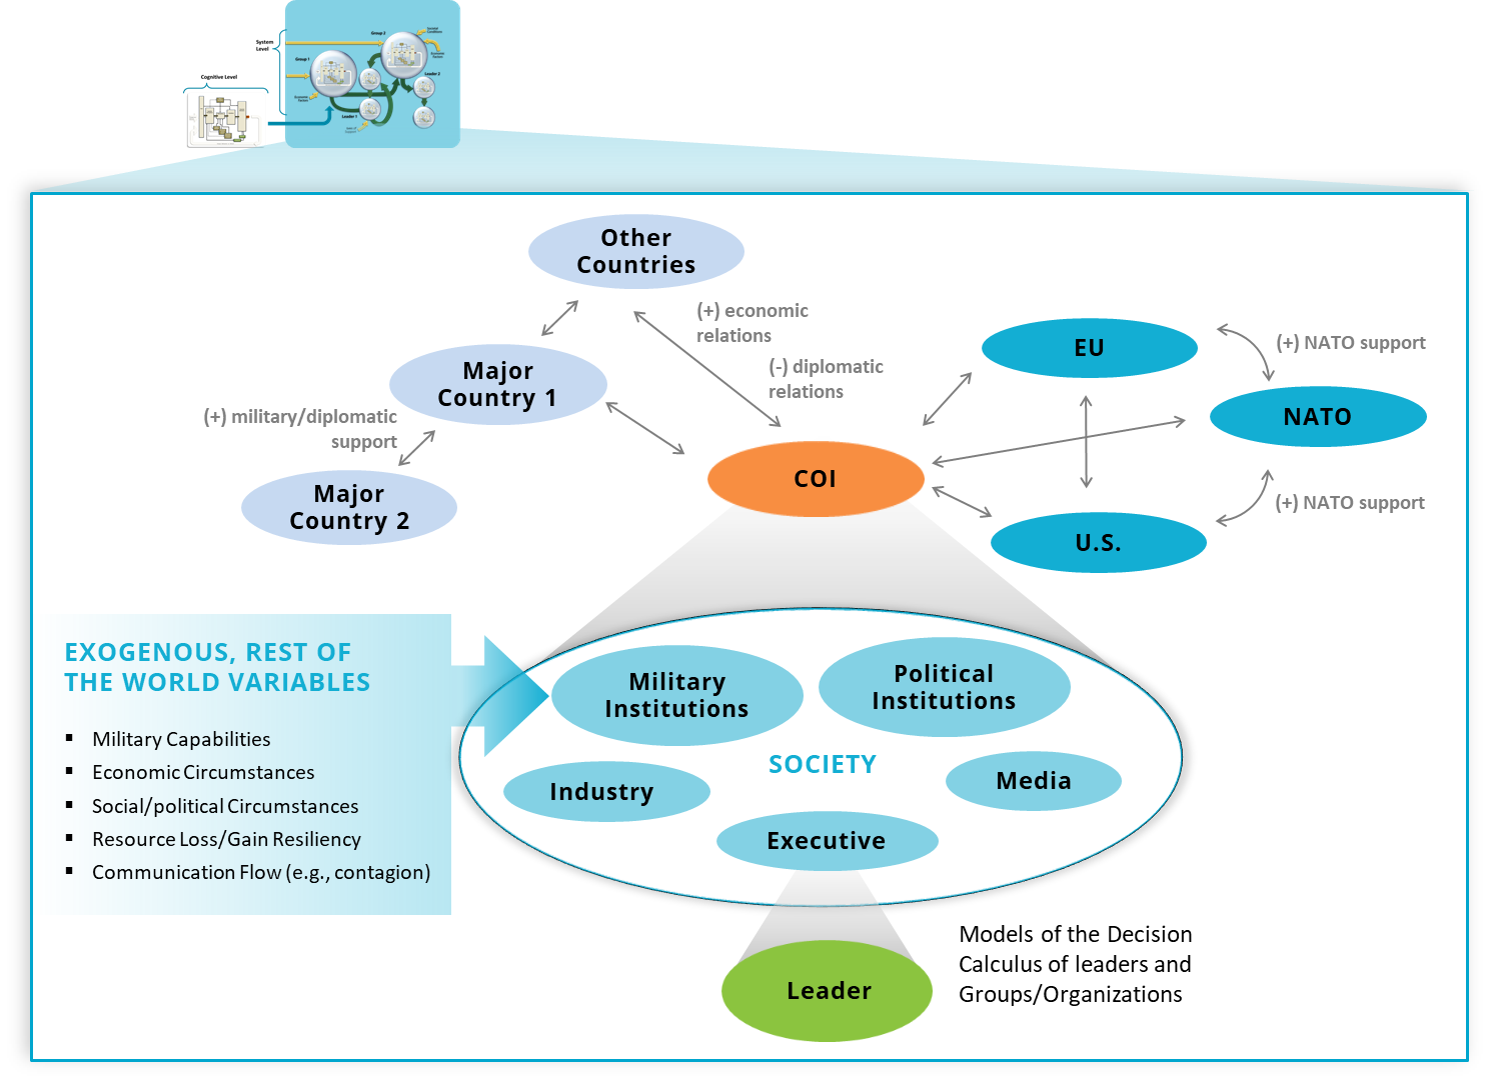
The figure below shows a real-world example of a country of interest and organizations that would be modeled at a systems level. Here exogenous, rest-of-the-world variables along with inter- and intra-country/organization dynamic variables influence the modeled assessment outputs. Each node circle represents the decision making of a specific modeled entity.
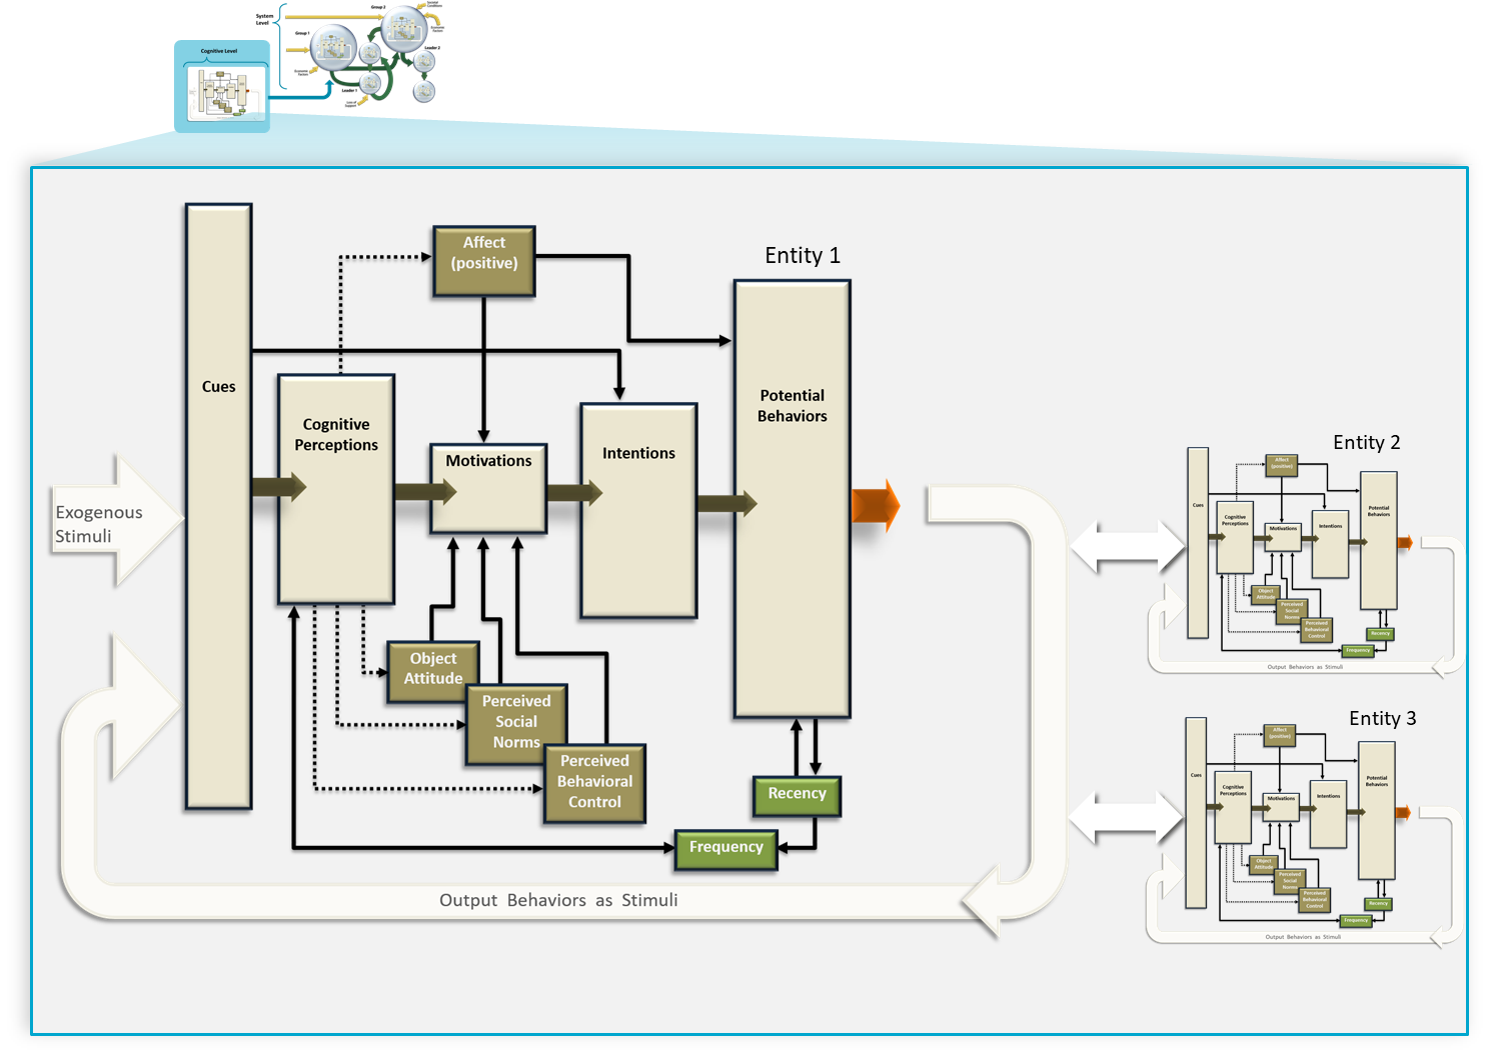
The modeled entities process and respond to the system-level information based upon empirically supported theories of decision-making. For example, these entities incorporate psychological and sociological elements within their structure, such as environmental cues, perceptions, motivations, intentions, and behaviors (see Figure below).
System-level information and behavioral outputs of one entity serve as informational cues to other entities, which can, in turn, process that information to produce additional behaviors across time. Thus, across time steps, modeled entities respond to actions of other modeled entities as well as to co-occurring environmental cues. Modeled human behavior is determined by local perceptions of world conditions, contained in a feedback process that link behaviors of others, conditions, and events.
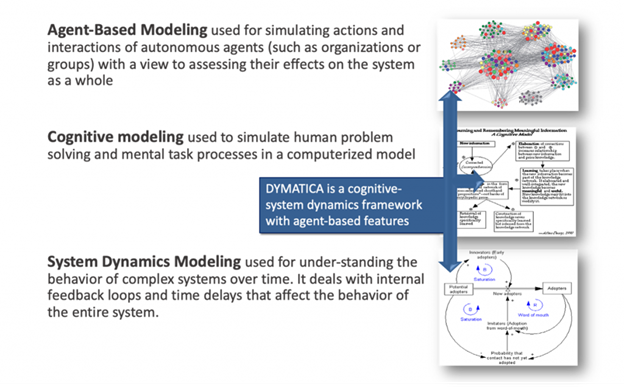
To develop a system that can analyze selected organizations, populations, and countries, DYMATICA uses a hybrid cognitive agent based, system dynamics modeling approach.
The system dynamics framework represents interactions and incorporates both endogenous and exogenous system components. Agent-based, cognitive models represent decision making of individuals within societies, which are embedded within the system dynamics framework. The system uses decision theories, data, and subject matter expert (SME) input to construct/parameterize equations using robust statistical regression methods. The theories and structure are expressed using differential equations using real observations or SME input to construct/parameterize equations using robust statistical regression methods.
The Process of Representing Decision making and Behavior
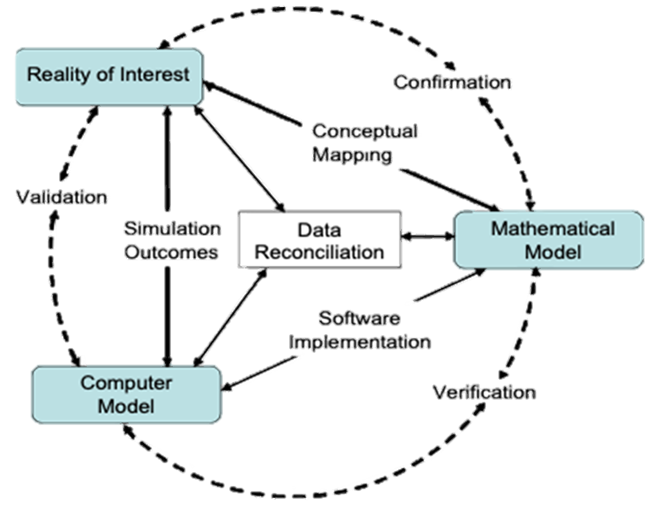
The conceptual model described above is mathematically represented within the Model of Dynamic Behavioral Choice. The figure below shows an example of the one-to-one relationship between the conceptual and mathematical models. Decision making is represented via differential equations based on empirically based theories of decision making.
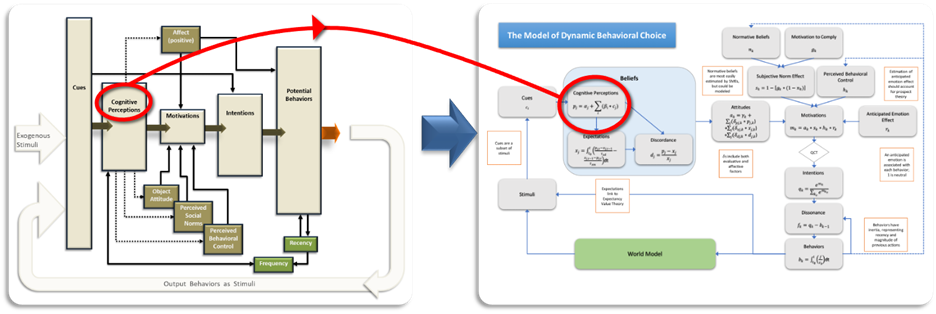
The figure below shows the model with the mathematical formulas and general descriptions. For example, each agent calculates an intention utility, or perceived benefit of taking the corresponding action, for each potential behavioral choice. Intention utilities are linear weighted sums of cognitive perceptions, expectations, and discordance, with weights determined by the entities’ cognitive resources (perceptions, attitudes, perceived social norms, and perceived behavioral control). These weights are determined by current data, SME information, and reports, which may be different for each agent class.
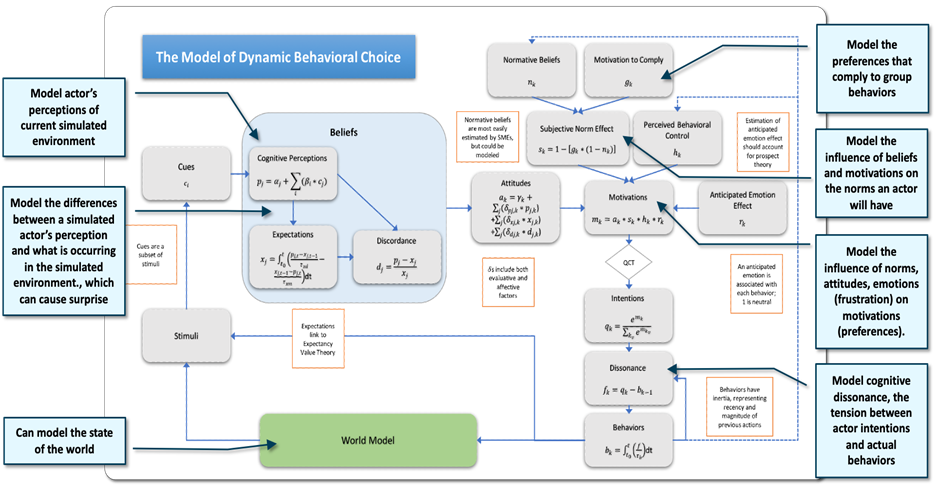
Looking at the figure from left to right shows how DYMATICA models represent how humans generally perceive their environment, process that information, and ultimately act upon this information. The inputs of the cognitive structure are represented as informational cues that are perceived from the environment. Cues are relevant stimuli pertaining to world conditions or human actions, which can provide varying levels of evidence that a specific cognitive perception is more salient. One collection of cues might form a specific perception regarding a current situation, whereas another collection of cues might form a completely different perception. Each cue will have a different weighing which provides evidence that a specific perception is salient. For some perceptions to become more salient, multiple cues are needed to be present. However, for other perceptions, only a few or even one cue might need to be present. It depends on the saliency of each cue and its evidence associated with that perception.
Within the current system, external data can adjust relevant model parameters that control the progression of the values through time such as changes in a country’s unemployment rate or income level. Rigorous statistical techniques determine the appropriate parameters and the uncertainty associated with their use. This uncertainty can later define the confidence in the results of an intervention analysis.
Model Updating
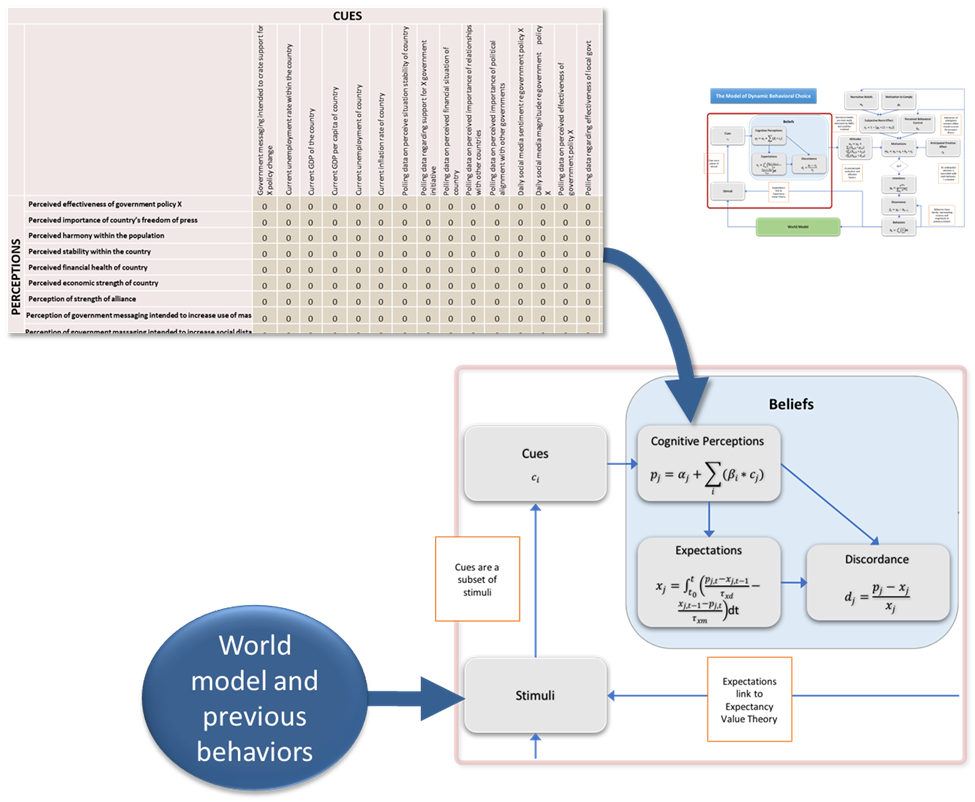
To account for naturally evolving changes in actual environments that are being modeled and simulated, DYMATICA requires regular updating – every 24 hours – of parameters within the model. This updating typically occurs at the cue-to-cogntive perception level such as reflecting changes in external stimuli in such things as unemployment rates, leader popularity, GDP per capita, and polling data regarding the general sentiment of a population. These stimuli act as cues that collectively can affect the perceptions within the model and ultimately modeled behaviors. These modeled behaviors can also serve as cues to other agent models. To model cues and their relationship with cognitive perceptions, DYMATICA is using a database matrix that connects each cognitive perception with their associated cues.
Depending on what is occurring within the simulated environment, each associated cue might be more salient. As shown in the example below, this cue-to-cognitive perception matrix is part of the modeled belief system within DYMATICA.
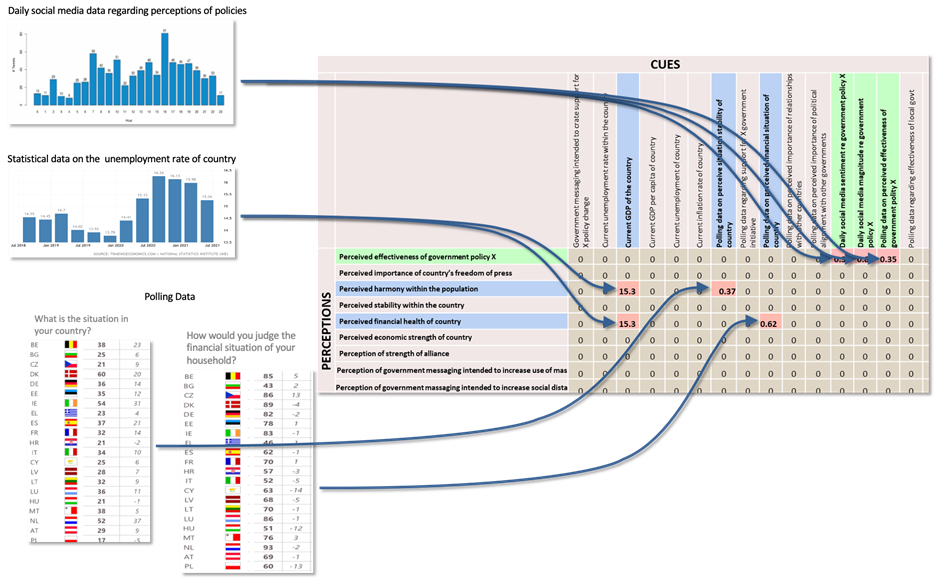
The figure below shows an example of data that could be used within the models. In this example only three types of data sources are used to simplify the explanation. Here, one data source is social media data that can be used to help provide current sentiment regarding a topic or organization. A second data source is government statistics pertaining to the unemployment rate of a country. The other data source is from polling research on the cognitive perceptions of populations regarding their wellbeing and the wellbeing of their country.
As each data source publishes its most current data, DYMATICA pulls in that data to calibrate the model with this new information. For example, the unemployment rate serves as a cue within the model, which is currently at 15.26%. As this changes, the weighting of the cue will change (up or down). This, along with cue-related polling data regarding the perceived financial situation of families (63% “Good”) will help determine (among many other cues) the level of saliency for the cognitive perception, ‘perceived financial health of country.’ Also, the saliency of the perception, ‘perceived harmony within the population’ is affected by both the unemployment rate cue and the polling data cue regarding the perceived situation of the country (37% “Better”).
Time Horizon and Increments
The time characteristics of an assessment, including time horizon and within that, time increments, will typically affect both the assessment granularity and what topics can be assessed. For instance, a time horizon can consist of assessments that cover a particular simulation time, such as several weeks, to months, to years, with topics of interest falling within the selected horizon. Within a time-horizon there will be time increments that define its granularity and determine the level of detail that the assessment will capture. These time increments might be as short as 10 second cycles to several-week cycles within the time horizon.
Adjustable Parameter Scales
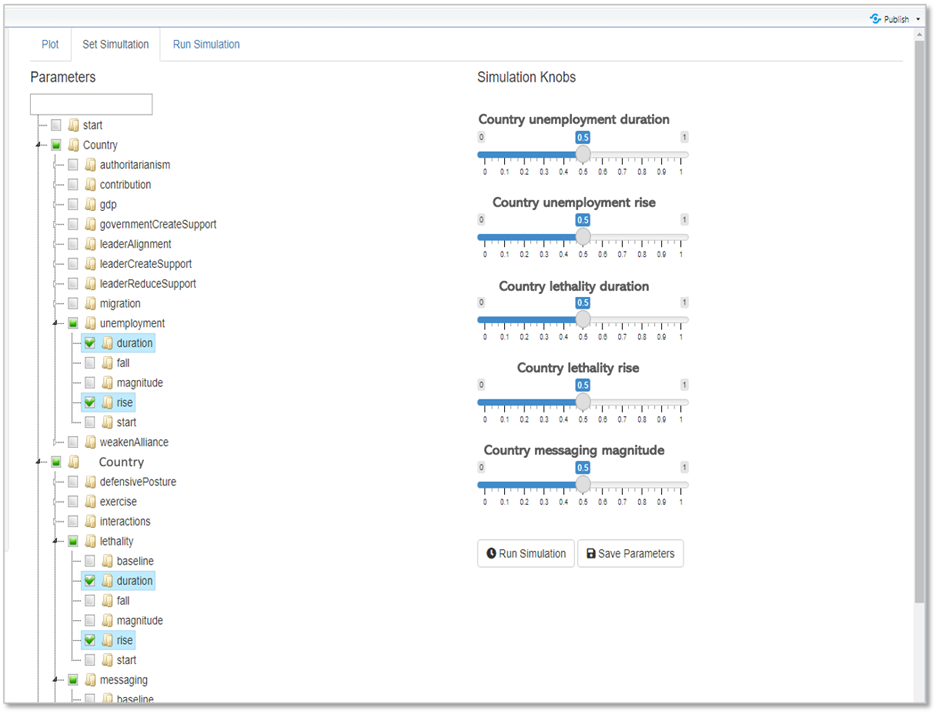
A primary way to perform predictive assessments is to modify cue parameters that reflect current conditions to assess how changes are likely to affect different behavioral outcomes. The parameters could adjust things such as a country’s GDP, stability, leadership support, migration, along with government behaviors and policies such as the intensity, duration, and location of different types of operations. Below is an example of adjustable parameters within DYMATICA.
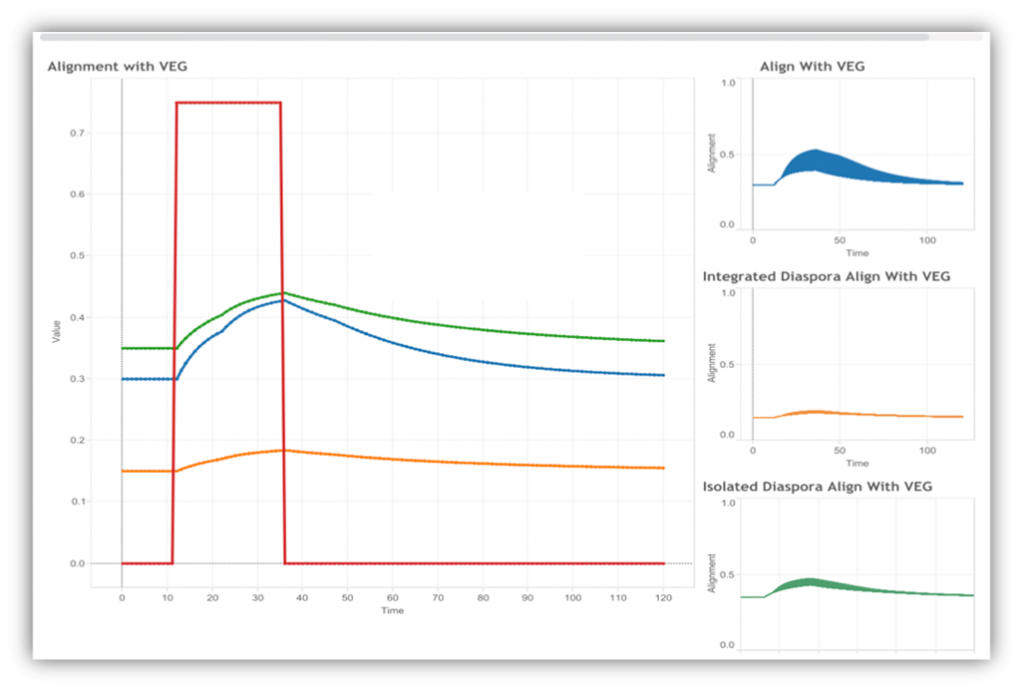
DYMATICA outputs are typically presented within the DYMATICA interface. However, if desired by the user, DYMATICA outputs can be presented in formats such as in CSV or Excel™. It can also be visualized by using the commercial software such as Tableau™ or PowerBI™. The figure below shows an example of a DYMATICA assessment output examining how a particular government action over a specified time (shown in red) is likely to influence a population’s support of violent extremist groups over time.
DYMATICA Forecaster function
As an additional feature, an initial Forecaster function has been developed to enable users to set threshold parameters to a level that reflects their interest or concern – For example, if a user becomes concerned that group violence could reach a certain level, then the user can set the threshold at that level (The red and blue dotted lines in the figure below serve as an example). DYMATICA can then search for evidence within different data and knowledge environments for conditions indicative of a likely future state that meets the threshold setting for that interest or concern. The intent is to provide anticipative warnings for “set & forget” monitoring.
Here, a user might be interested in uncovering a specific situation such as growing anger within a specific group towards a population that is currently not being noticed. The user may want to know if or when DYMATICA will anticipate a specific level of anger at the set threshold settings. DYMATICA automatically searches data/information sources for evidence that this situation is about to occur or has begun to occur.
When or if the system gathers information pertaining to conditions that meets the threshold, the user will be notified via the submission of a warning (such as in a text or email) that an event or condition of concern or interest is predicted to occur. For example, a user can select threshold settings associated with a country’s economic strength, health security, and anti-democratic trends. If recent data associated with government statistical, polling, social media data and/or subject matter expert determinations is found to be consistent with the parameter settings, the user will be alerted. To accomplish this, DYMATICA gathers and recalibrates the model with relevant data/information every 24 hours to determine if conditions meet threshold values assigned by a user. The figure below shows the Forecaster function being activated. To activate this function a user would simply click anywhere on a selected DYMATICA assessment graph. Where the user clicks on the screen will create a dashed red line which will set a threshold level. Stored scenarios are re-examined every 24 hours.
Model Assessment Confidence
As a standard approach, DYMATICA employs model confidence management that incorporate uncertainty quantification (UQ) and sensitivity analysis (SA), as well as other validation techniques. This involves ongoing, collaborative assessment to ensure that the final product provides useful information for the desired application. Uncertainty quantification is also used to learn how uncertainty in inputs ultimately propagates through the model to affect results. By simultaneously performing UQ for model parameters and potential interventions, the framework can determine the portfolio of interventions within a range of probabilities of success despite uncertainty. The risk associated with the intervention is also quantified. Once parameter ranges are defined, various options are available for propagating uncertainty throughout a model.
This approach not only enables the comparing and contrasting of alternative outcomes, but also reflects the uncertainty that an intervention must accommodate. The resulting assessment output typically portrays how various courses of action and conditions jointly affect various endogenous model parameters at the geopolitical level (e.g., country interactions), group level (e.g., political parties, ethnic groups, urban/rural group, etc.) and individual level, such as leaders of countries.
For more information
- Bernard, M.L. (2019). Sociocultural Behavior Influence Modeling & Assessment: Current Work and Research Frontiers. Senior Leadership Roundtable on Military and Defense Aspects of Border Security in South East Europe, 141, 135.
- Bernard, M.L., Backus, G.A., Naugle, A.B., Jeffers, R.F., Damron, R.W. Modeling sociocultural influences on decision making: Assessing conflict and stability: Understanding Conflict, Enabling Stability, 449-471. Taylor & Francis. (2016).
- Jeffers, R.F., Bernard, M.L., Passell, H., & Silver, E. (2015). Behavior influence assessment of impacts of the Grand Ethiopian Renaissance Dam on unrest and popular support within Egypt. Procedia Manufacturing, 3, 4014-4021.
Fact Sheet
Click Fact Sheet to download PDF.
Brochure
Click Brochure to download PDF.
Presentation
Click Presentation to download PDF.