Sandia National Laboratories in collaboration with Kitware, Inc. added new capabilities to store and visualize Discontinuous Galerkin (DG) simulation results using the Exodus/ParaView workflow to support the EMPIRE plasma physics application. The DG methods employed by EMPIRE were selected because of their natural conservation properties, support of shock capturing methods, and strong spatial locality which are advantageous to solvers relevant to plasmas. However, Sandia’s traditional visualization workflow involving Exodus and ParaView did not support DG without substantial preprocessing. This effort introduced new data structures and visualization support to the software stack to support DG methods including high-order DG methods.
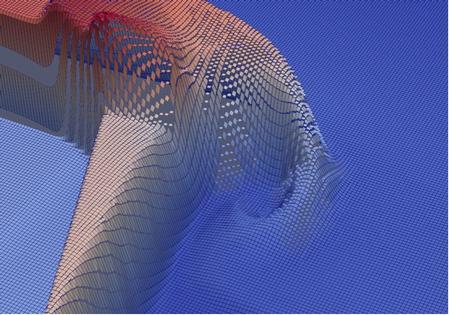
The Sandia team added key pieces of “DG metadata” in combination with the existing Exodus data structures to create a mesh that represents the discontinuities inherent in DG. Kitware then modified ParaView to recognize the DG metadata and use it to “explode” the mesh from a continuous Exodus mesh to a discontinuous internal representation. As part of this process, shared vertices are replicated to give elements independent vertex instances and additional vertices are added as necessary to match the basis order of the mesh to the DG fields. The result is a faithful visualization of the discontinuities that can be used for analysis and debugging. Figure 1 shows the electron density of the 2D Triple Point Problem warped in the Z dimension to illustrate the discontinuity between elements. Areas of the mesh with small discontinuities have a smooth appearance while areas with larger discontinuities have distorted elements and gaps between elements.
This effort has added DG capabilities to the visualization tools that analysts know, understand and trust. With this new capability available, other applications (eg. SPARC and Flexo) have the opportunity to visualize their DG results without requiring additional postprocessing of simulation results.