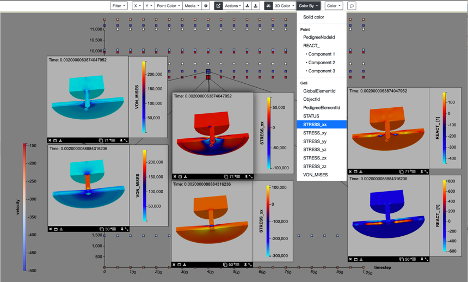
In support of analyst requests for Mobile Guardian Transport studies, researchers at Sandia National Laboratories have expanded data types for the Slycat ensemble-analysis and visualization tool to include 3D surface meshes. Analysts can now compare sets of surface meshes using synchronized 3D viewers, in which changing the viewpoint in one viewer changes viewpoints in all the others. To illustrate this capability, the Slycat team performed an ensemble analysis for a material-modeling study that examines fracturing behavior in a plate after being impacted by a punch. Input parameters include plate and punch density, friction coefficient, Young’s modulus, and initial punch velocity. To compare different mesh variables over the same geometry, the analyst clones a mesh into multiple views, as shown in Figure 1. The two runs represent opposite extremes for the initial punch velocity, with the 3D viewers in the top row showing the fastest initial velocity, and the viewers in the bottom row showing the slowest. The mesh variables in the two rows are vertically matched top and bottom, so by comparing rows, you can compare the distinctly different stress behaviors of the extremes.
This new capability represents a significant advance in our ability to perform detailed comparative analysis of simulation results. Analyzing mesh data rather than images provides greater flexibility for post-processing exploratory analysis.