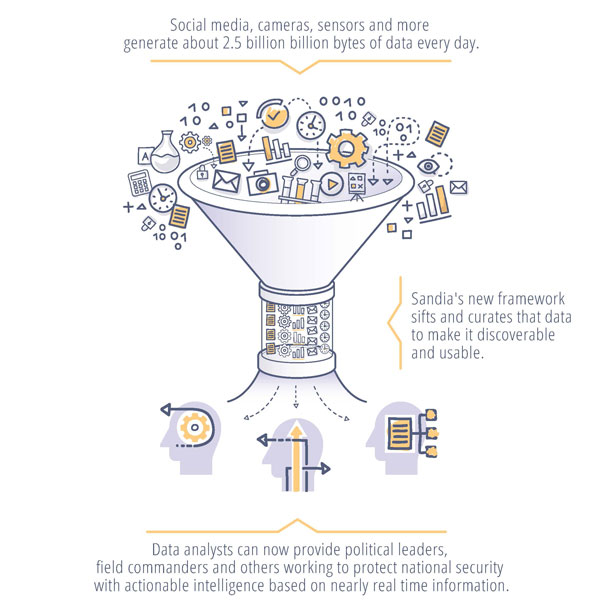
Social media, cameras, sensors and more generate huge amounts of data that can overwhelm analysts sifting through it all for meaningful, actionable information to provide to decision-makers such as political leaders and field commanders responding to security threats.
Sandia researchers are working to lessen that burden by developing the science to gather insights from data in nearly real time.
“The amount of data produced by sensors and social media is booming — every day there’s about 2.5 quintillion (or 2.5 billion billion) bytes of data generated,” said Tian Ma, a computer scientist and project co-lead. “About 90% of all data has been generated in the last two years — there’s more data than we have people to analyze,” he said. “Intelligence communities are basically overwhelmed, and the problem is that you end up with a lot of data sitting on disks that could get overlooked.”
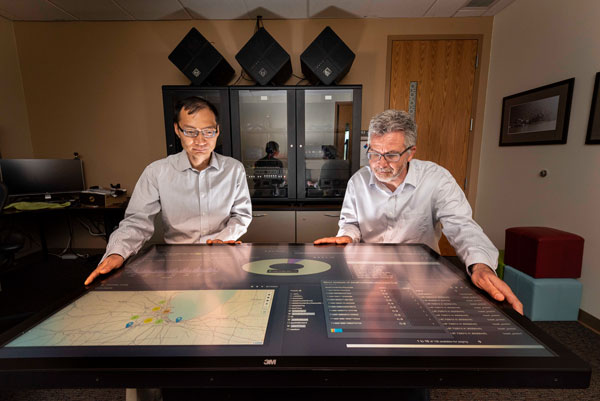
Sandia researchers worked with students at the University of Illinois Urbana-Champaign, an academic alliance partner, to develop analytical and decision-making algorithms for streaming data sources and integrate them into a nearly real-time distributed data processing framework using big data tools and computing resources at Sandia. The framework takes disparate data from multiple sources and generates usable information that can be acted on in nearly real time.
To test the framework, the researchers and the students used Chicago traffic data such as images, integrated sensors, tweets and streaming text to successfully measure traffic congestion and suggest faster driving routes around the city for commuters. The research team selected the Chicago traffic example because the data inputted has similar characteristics to data typically observed for national security purposes, said Rudy Garcia, a computer scientist and project co-lead.
Drowning in data
“We create data without even thinking about it,” said Laura Patrizi, a computer scientist and research team member, during a talk at the 2019 United States Geospatial Intelligence Foundation’s GEOINT Symposium. “When we walk around with our phone in our pocket or tweet about horrible traffic, our phone is tracking our location and can attach a geolocation to our tweet.”
To harness this data avalanche, analysts typically use big data tools and machine learning algorithms to find and highlight significant information, but the process runs on recorded data, Tian said.
“We wanted to see what can be analyzed with real-time data from multiple data sources, not what can be learned from mining historical data,” Tian said. “Actionable intelligence is the next level of data analysis where analysis is put into use for near-real-time decision-making. Success on this research will have a strong impact to many time-critical national security applications.”
Building a data processing framework
The team stacked distributed technologies into a series of data processing pipelines that ingest, curate and index the data. The scientists wrangling the data specified how the pipelines should acquire and clean the data.
“Each type of data we ingest has its own data schema and format,” Rudy said.” In order for the data to be useful, it has to be curated first so it can be easily discovered for an event.”
Hortonworks Data Platform, running on Sandia’s computers, was used as the software infrastructure for the data processing and analytic pipelines. Within Hortonworks, the team developed and integrated Apache Storm topologies for each data pipeline. The curated data was then stored in Apache Solr, an enterprise search engine and database. PyTorch and Lucidwork’s Banana were used for vehicle object detection and data visualization.
Finding the right data
“Bringing in large amounts of data is difficult, but it’s even more challenging to find the information you’re really looking for,” Rudy said. “For example, during the project, we would see tweets that say something like ‘Air traffic control has kept us on the ground for the last hour at Midway.’ Traffic is in the tweet, but it’s not relevant to freeway traffic.”
To determine the level of traffic congestion on a Chicago freeway, ideally the tool could use a variety of data types, including a traffic camera showing flow in both directions, geolocated tweets about accidents, road sensors measuring average speed, satellite imagery of the areas and traffic signs estimating current travel times between mileposts, said Forest Danford, a computer scientist and research team member.
“However, we also get plenty of bad data like a web camera image that’s hard to read, and it is rare that we end up with many different data types that are very tightly co-located in time and space,” Forest said. “We needed a mechanism to learn on the 90 million plus events (related to Chicago traffic) we’ve observed to be able to make decisions based on incomplete or imperfect information.”
The team added a traffic congestion classifier by training merged computer systems modeled on the human brain on features extracted from labeled images and tweets, and other events that corresponded to the data in time and space. The trained classifier was able to generate predictions on traffic congestion based on operational data at any given time point and location, Forest said.
Professors Minh Do and Ramavarapu Sreenivas and their students at UIUC worked on real-time object and image recognition with web-camera imaging and developed robust route-planning processes based off the various data sources.
“Developing cogent science for actionable intelligence requires us to grapple with information-based dynamics,” Sreenivas said. “The holy grail here is to solve the specification problem. We need to know what we want before we build something that gets us what we want. This is a lot harder than it looks, and this project is the first step in understanding exactly what we would like to have.”
Moving forward, the Sandia team is transferring the architecture, analytics and lessons learned in Chicago to other government projects and will continue to investigate analytic tools, make improvements to the Labs’ object recognition model and work to generate meaningful, actionable intelligence.
“We’re trying to make data discoverable, accessible and usable,” Rudy said. “And if we can do that through these big data architectures, then I think we’re helping.”