The power, scale and efficacy of today’s HPC systems makes them turbocharged vehicles for innovation and discovery. A new capability developed by Sandia researchers seeks to maximize efficiency and performance for every one of those vehicles and the application developers who drive them.
The capability, called AppSysFusion, gives HPC users and administrators an “always on” data collection and analysis framework to investigate, diagnose and efficiently address performance issues at runtime or post-run. The framework functions something like the on-board diagnostics in a modern car, going beyond simple alerts, check engine for example, to analyze detailed performance data and indicate potential solutions.
In HPC terms, this rapid diagnostic capability provides a means for reducing downtime and the number of debugging, development and other non-science runs, thereby increasing science throughput for HPC systems as they continue addressing the nation’s most significant scientific and security challenges.
Toward this end, the project team that developed AppSysFusion seeks to enhance the computing performance available to every team that uses an HPC system. The project improves and broadens access to HPC monitoring capabilities, providing users and administrators with real-time insights into both application and systems performance. The capability provides resource utilization views, application progress metrics and root cause diagnosis capabilities. This enables application users and developers, system administrators and HPC architects to make data-driven decisions about how shared HPC resources are provisioned and utilized. The project team also sees it as a key step toward a more advanced self-driving system that would further automate performance enhancement.
AppSysFusion derives its name from a signature innovation – the ability to rapidly merge performance data gathered from running applications with data pulled from the system itself. Correlating these data sets is often crucial to fully understanding performance issues and identifying their source but, without automation, the task can take weeks of human effort. By making the combined data easily available for use, AppSysFusion avoids that detour and helps untangle previously intractable performance issues.
The AppSysFusion capability is built around the Lightweight Distributed Metric Service, or (LDMS), a Sandia-developed monitoring application recognized in 2015 with an R&D 100 award for its ability to regularly collect fine-grained detail about HPC system resources. Lightweight, in this instance is crucial; it means that the data gathering adds no significant processing burden to the HPC resources it is monitoring.
An LDMS capability called Streams also enables scalable transport of information from application data sources. AppSysFusion currently integrates LDMS with three application monitoring frameworks:
- Kokkos – an application portability layer developed at Sandia and used heavily by code teams. AppSysFusion samples Kokkos function timers to obtain lightweight application performance information.
- Darshan – an I/O profiling tool developed at Argonne National Laboratory.
- Caliper – an application profiler from Lawrence Livermore National Laboratory, used at multiple HPC sites. Caliper provides additional application performance information.
The application and system data gathering capabilities of AppSysFusion collect thousands of metrics per compute-node. In its current implementations on Sandia HPC systems, AppSysFusion generates roughly 15 terabytes of system and application performance data per day. That data is stored in a custom database created to handle the size and complexity of HPC monitoring data.
To make it all work, the project team developed two new components. To assist in collecting the application data, the team developed connectors to link the application monitoring frameworks with the lightweight data-collection mechanisms. The team also set up the engine for analyzing and visualizing the time-aligned application and system data.
This engine enables users to create custom modules for data transformation and interpretation which can range from simple statistical measurements, such as rates and averages to things as complex as machine learning modeling for anomaly detection. The results are viewable, during runtime, in meaningful and actionable dashboards created by the project team in collaboration with application development teams and system administrators. Taken together, the capabilities of AppSysFusion enable other potential uses:
- Improving system design and acquisition by identifying common performance bottlenecks.
- Aiding application development with application-related timing information gathered on production runs at scale. This can alert developers to optimizations that can improve performance.
- Using artificial intelligence and machine learning to detect and diagnose anomalous and poor performance and to identify opportunities for improving performance.
- Users can potentially reconfigure or rebalance applications in response to detected performance problems.
- Using run time feedback for scheduling and resource management, to avoid killing jobs before completion when run time has been underestimated and when delaying other jobs is acceptable.
- Using historical job resource utilization and performance profiles to potentially suggest better node counts, run times and application placements.
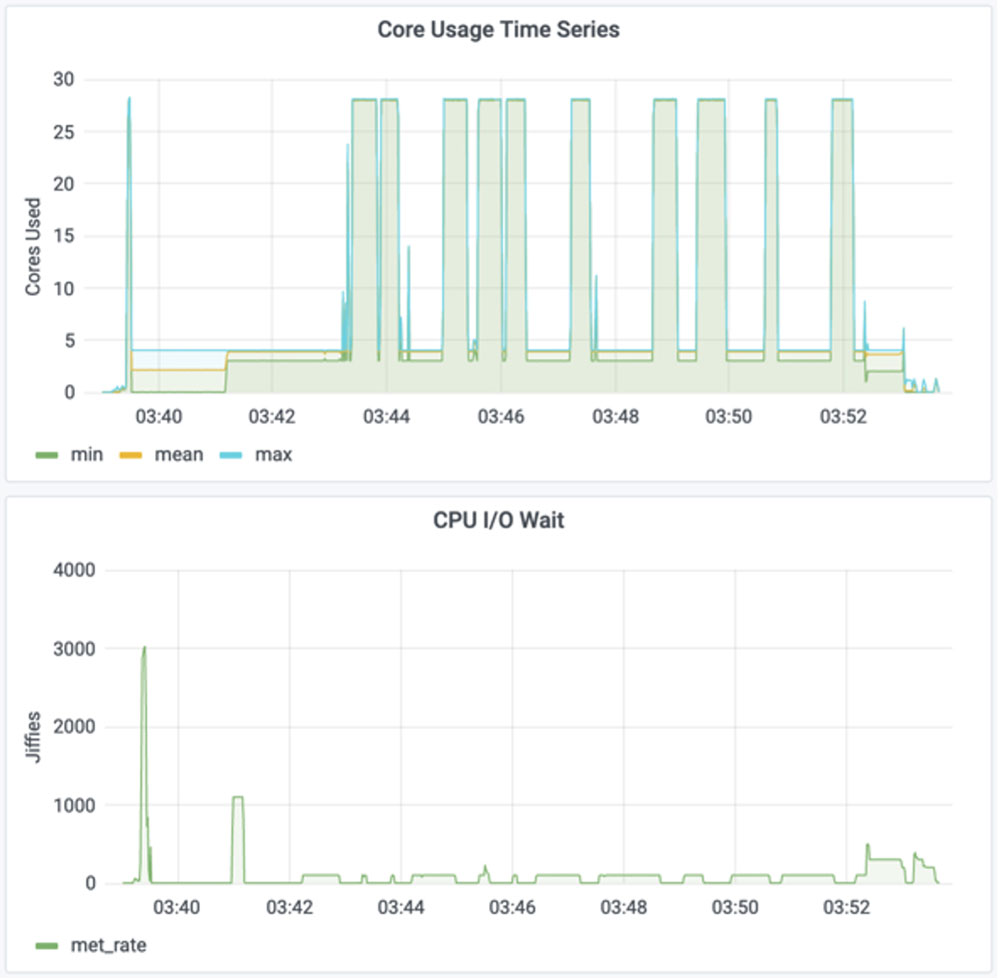
![Figure 2. By seeing the allocation’s read, write and seek rate for the scratch filesystem, it was found that the application’s implementation of NetCDF3[KM20] had unnecessary reads and seeks while writing binary output (left). By changing the format to NetCDF4[KM21] , those unnecessary reads and seeks were removed.](https://www.sandia.gov/app/uploads/sites/165/2023/10/p41-fig2a-allocationread1-alwayson_1000-951x1024.jpg)
Currently, AppSysFusion is in use at Sandia by multiple application teams’ developers and analysts for diagnostics and for resource allocation decisions. System administrators are using the capability for getting resource performance and utilization information.
Project team members plan to take the system’s capabilities even further. The team’s ultimate goal is to develop a self-driving, capability in which monitoring data would be gathered, analyzed and acted upon automatically by the system to optimize performance instantaneously.