Nonlocal Averaging
Problem Description
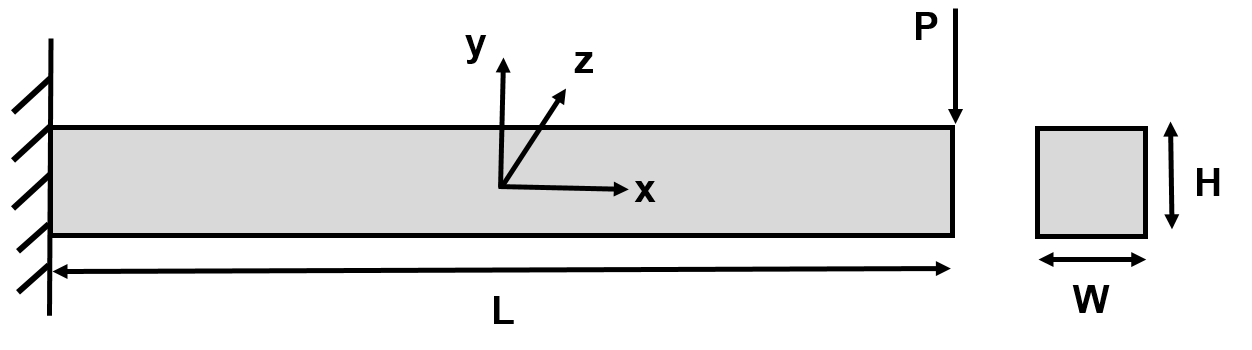
Fig. 32 Cantilever beam problem definition
This problem demonstrates usage of the nonlocal averaging capability to calculate an average of nodal accelerations. A cantilever beam with length L = 1, width W = 0.1, and height H = 0.1 is subjected to a tip load. The nonlocal nodal acceleration is computed at the free end within a spherical region with the center point at the centroid of the free end’s face and a diameter set as the diagonal of the square face, ensuring that the sphere encloses the entire free end of the beam. This is compared to the global acceleration over the entire body and the local acceleration at a single node to demonstrate differences in techniques for evaluating acceleration over time.
Loading and Boundary Conditions
With this beam being a cantilever, the left end has a fixed displacement in all directions. A tip load with magnitude P = 10 in the -y direction is applied at the free (right) end of the cantilever. A constant gravitational acceleration is imposed with zero initial velocity.
Finite Element Model

Fig. 33 Cantilever beam problem mesh
The mesh is uniform with edge length of 0.01 and the element type is the mean quadrature, linear hexahedron.
Material Model
The elastic material model given in the table below is used.
Metric units are used |
|---|
Displacement: meters |
Mass: kilograms |
Time: seconds |
Force: Newtons |
Material Properties |
||
|---|---|---|
Young’s Modulus |
E |
\(73\times10^9\) |
Poisson’s Ratio |
\(\nu\) |
0.3 |
Density |
\(\rho\) |
2800 |
Feature Tested
Nonlocal averaging of nodal acceleration.
Results and Discussion
It can be seen that the global average acceleration starts off considerably lower than the nonlocal average acceleration and is steadily decreasing. The nonlocal average calculation shows the acceleration is significantly higher at t = 0 and then initially has a rapid descent. It then stays nearly constant before dipping to its minimum. Thereafter it increases somewhat quickly and then stays about constant. These results demonstrate that the nonlocal average accurately captures the higher acceleration response that is otherwise missed when looking at the global average. Added for comparison is the time history of the acceleration of a single node on the top edge of the free end. As expected, this acceleration forms an upper bound for the nonlocal average acceleration. It is evident that the nonlocal average captures the behavior of the tip better than the global acceleration while also smoothing out much of the noisy response of a local acceleration measured at a single node.
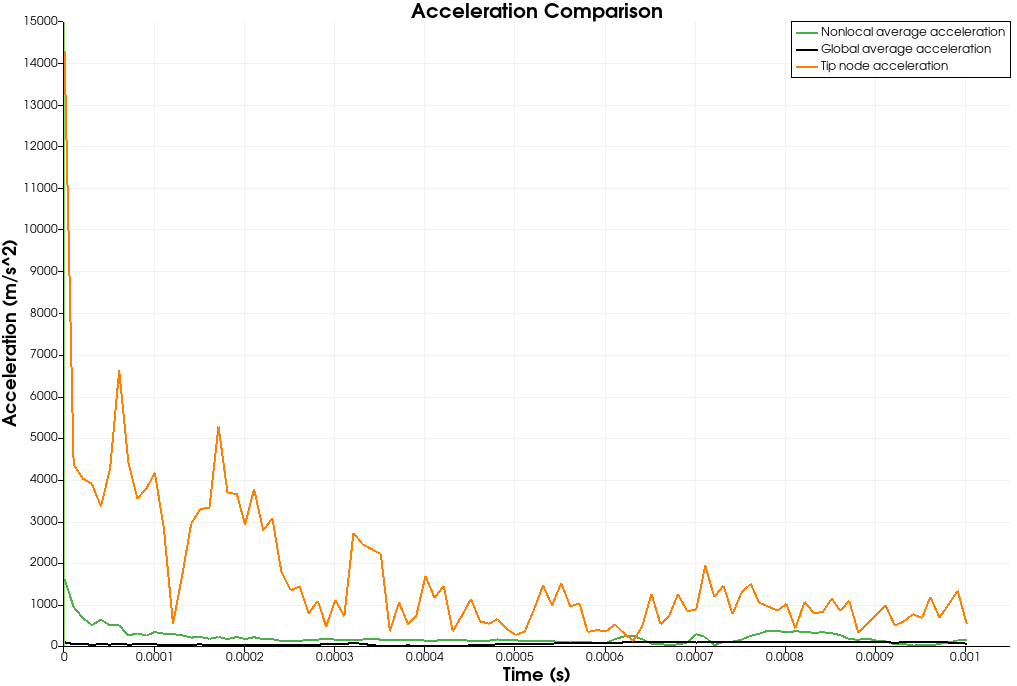
Fig. 34 Comparison between acceleration averages over time