Cubit 16.02 User Documentation
The base command to view the quality of a mesh is the following:
Quality {geom_and_mesh_list} [metric name] [quality options] [filter options]
Where the list contains surfaces and volumes and groups that have been meshed with faces, triangles, hexes, and tetrahedra; the list can also specify individual mesh entities or ranges of mesh entities.
If a specific metric name is given, only that metric or metrics are computed for the specified entities. Note that the metric given must be one which applies to the given entities. To see a list of quality metrics for individual entities see the Mesh Quality Assessment section and select the desired entity type: hexahedral, tetrahedral, quadrilateral, triangle. or edge
The metric name can also be more general than a specific metric. Four generalized options for metric name can be used:
Allmetrics: All of the metrics corresponding to the element type of the geom_and_mesh_list will be computed and reported.
Algebraic: All algebraic metrics corresponding to the element type of the geom_and_mesh_list will be computed and reported (e.g., Shape, Shear, Relative Size).
Robinson: All Robinson metrics corresponding to the element type of the geom_and_mesh_list will be computed and reported (e.g., Aspect Ratio, Skew, Taper).
Traditional: All the traditional Cubit metrics corresponding to the element type of the geom_and_mesh_list will be computed and reported (e.g., area, volume, angle, stretch, dimension).
If no metric name is supplied, the default metric is "Shape".
The quality options are:
If the user specifies individual, one quality summary is generated for each entity specified on the command line. If the user specifies global, or specifies neither, then one quality summary is generated for each mesh element type.
[ Draw [Histogram] [Mesh] [Monochrome] [Add] ]
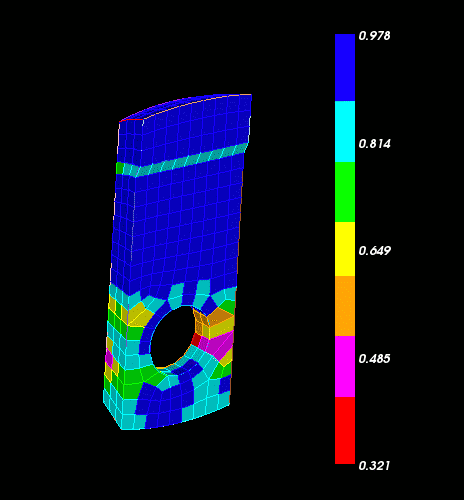
If the user specifies draw histogram, then histograms are drawn in a separate graphics window. The window contains one histogram for each quality metric. If the user specifies draw mesh, then the mesh elements are drawn in the default graphics window. A color-coded scale will appear in the graphics window. The histogram and mesh graphics are color coded by quality: a small metric value corresponds to red, a large metric value to blue and in-between values according to the rainbow. You can grab the side of color bar and resize it. The text gets smaller as the color bar width decreases. You can also grab in the middle of the color bar and move it around. It can be repositioned to the bottom or top and it will automatically change orientations. See Figure 1.

Figure 1. Quality Scale
If monochrome is specified, then the graphics are not color-coded. If add is specified, then the current display is not cleared before drawing the mesh elements.
[ List [Detail] [Id] [Verbose Errors] ] [Geometry]
If the user specifies List, then the quality data is summarized in text form. List Detail lists the mesh elements by ascending quality metric. List Id lists the ids of the mesh elements. If Verbose Errors is specified, then details about unacceptable quality elements are printed out above the summaries. If Geometry is specified, then a list of the geometric entities that own the elements will be printed.
There are several options available to filter the output of the quality command, using the following filter options :
[High <value>] [Low <value>]
Discards elements with metric values above or below value; either or both can be used to get elements above or below a specified value or in a specified range.
[Top <number>] [Bottom <number>]
Keeps only number elements with the highest or lowest metric values. For example, " Quality hex all aspect ratio top 10 " would request the elements with the 10 highest values of the aspect ratio metric.