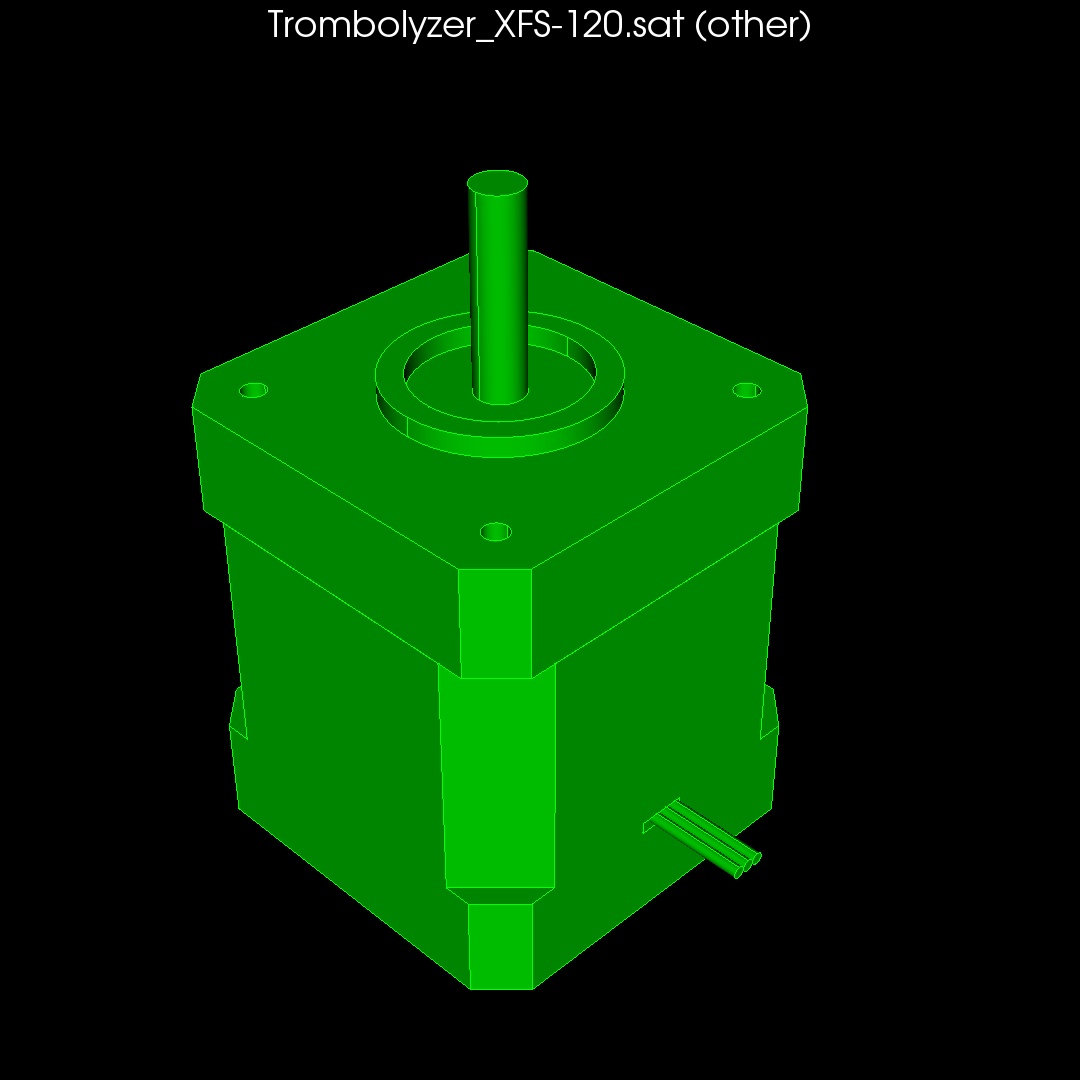
Figure 1. Navigation to Power Tool and Options panel.
|
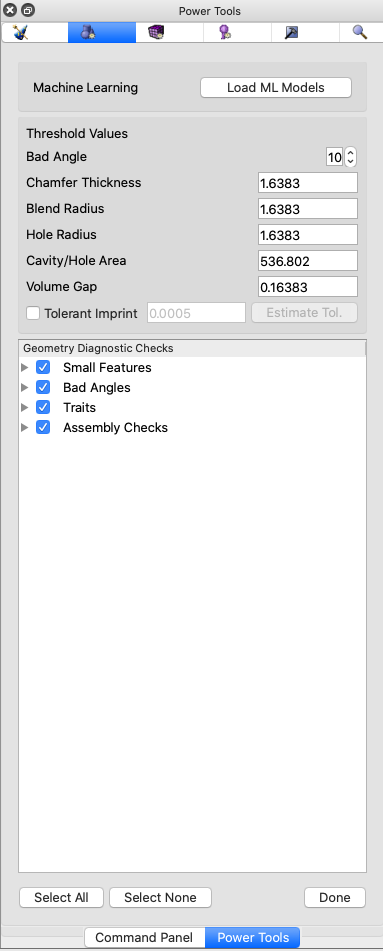
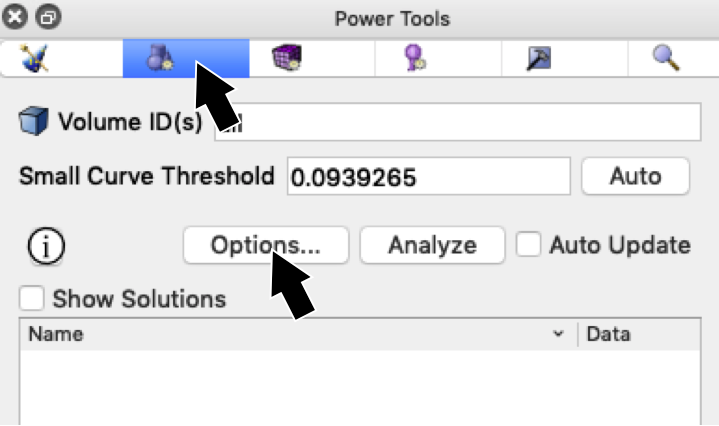
Figure 2. Options panel without ML models loaded |
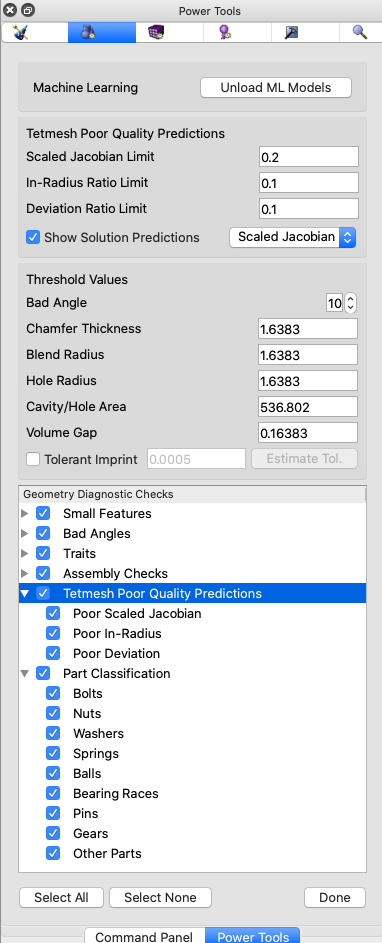
Figure 3. Options panel after loading ML models. |
Cubit 15.7 User Documentation
This page describes the machine learning tools that are part of Cubit's Geometry Power Tool for tet mesh quality prediction and part classification.
Background:
The Geometry Power Tool in Cubit provides a series of diagnostic checks on your model used to defeature or simplify a CAD model prior to meshing. Clicking the Analyze button will perform the selected diagnostic tests and display an expanding tree listing geometric entities that are identified by each test. Once identified, suggested solutions can be easily previewed and executed.
This new capability enhances the Geometry Power Tool using state-of-the-art machine learning (ML) methods to predict meshing outcomes, suggest solutions as well as classify certain common part types.
Enable Machine Learning:
Use the following procedure to access the new ML capabilities:
Figure 1. Navigation to Power Tool and Options panel.
|
Figure 2. Options panel without ML models loaded |
Figure 3. Options panel after loading ML models. |
The following describe the additional diagnostics available when ML is enabled in the Geometry Power Tools.
The solid model used as the basis for a tetrahedral mesh may contain small features or angles that can lead to poor mesh quality or very small elements. This diagnostic will provide a list of entities (vertices, curves, surfaces) that are predicted to result in poor quality tet elements sorted by their predicted mesh quality metric. This allows the user to quickly focus on regions of the model that will result in the worst mesh quality and apply geometry operations to improve the meshing outcome without having to mesh.
Three different mesh quality metrics are used for the basis of the predictions: Scaled Jacobian, In-radius and Deviation. Entities identified by these diagnostics will be sorted according to their ML-predicted metric starting with the worst quality entity. The three edit fields at the top of the Options panel control the quality limit. For example, a Scaled Jacobian Limit of 0.2 will identify all geometry entities predicted to have nearby tet elements whose Scaled Jacobian is less than 0.2. For our purposes, "nearby tets" are defined as those within two edge lengths of the geometric entity.
Context Menus: To display all entities in a specific category, select the diagnostic category title and use the right click context menu to choose Draw. Expanding the list will display individual entities that can be visualized using standard draw tools such as Zoom To, Fly In, Draw Owning Volume, Draw with Neighbors, etc. When one or more entities are selected in the list, a context menu also provides access to selected command panel options. When multiple entities are selected, the context menu can be used to invoke command panels to operate on multiple entities simultaneously.
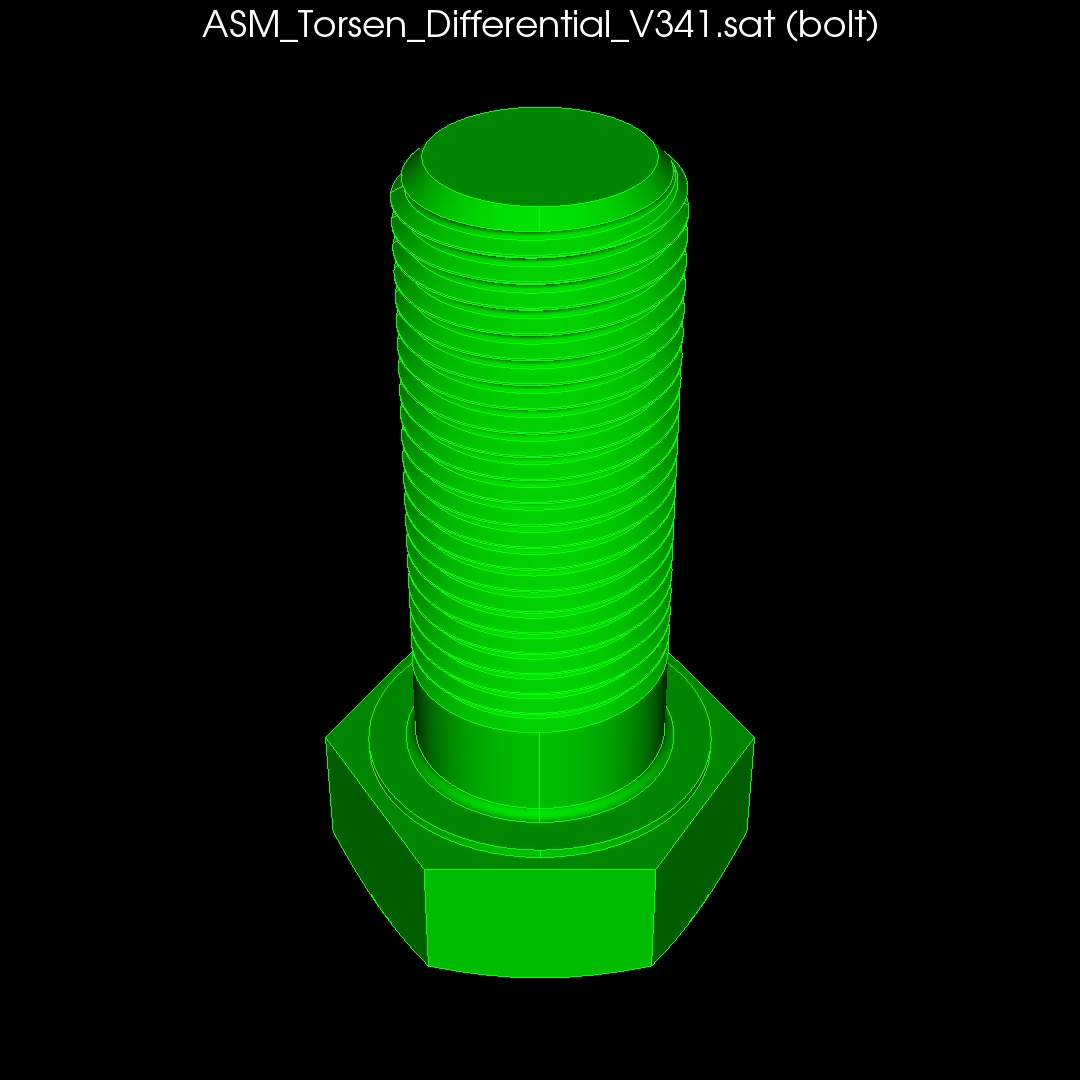
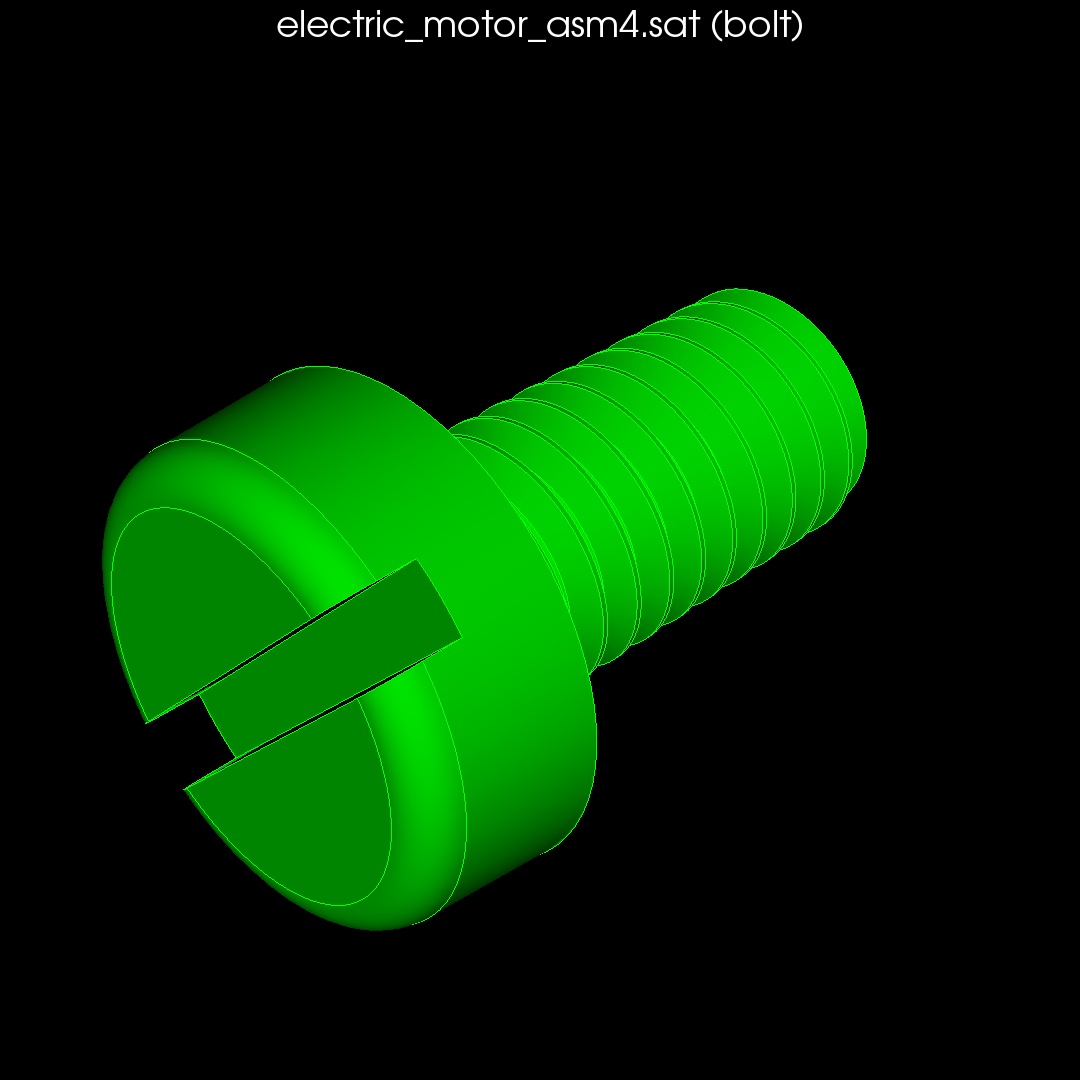
This diagnostic provides the ability to classify volumes according to several common part types. When selected, characteristic geometric features of each volume will be computed and ML methods will be used to determine the part classification. Each volume will be placed into a list based on its most probable categorization. Volumes in each classification will be ordered based upon a Confidence metric. A confidence of 1.0 indicates a 100% confidence of categorization. Confidence values closer to 0.5 are less likely to be categrized correctly, but ML indicated a higher probablility than other part types. The current part categories are illustrated below showing a few examples from each category:
|
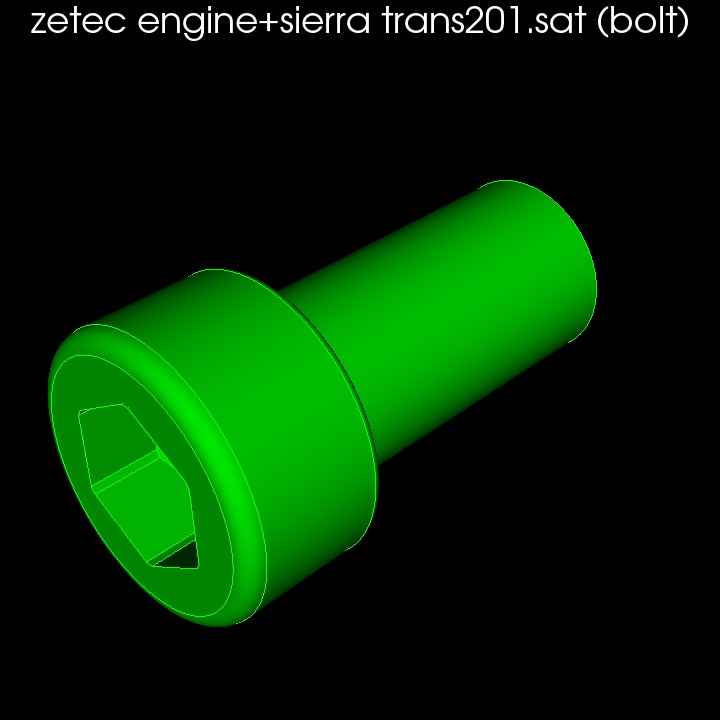
Bolts |
|
|
|
|
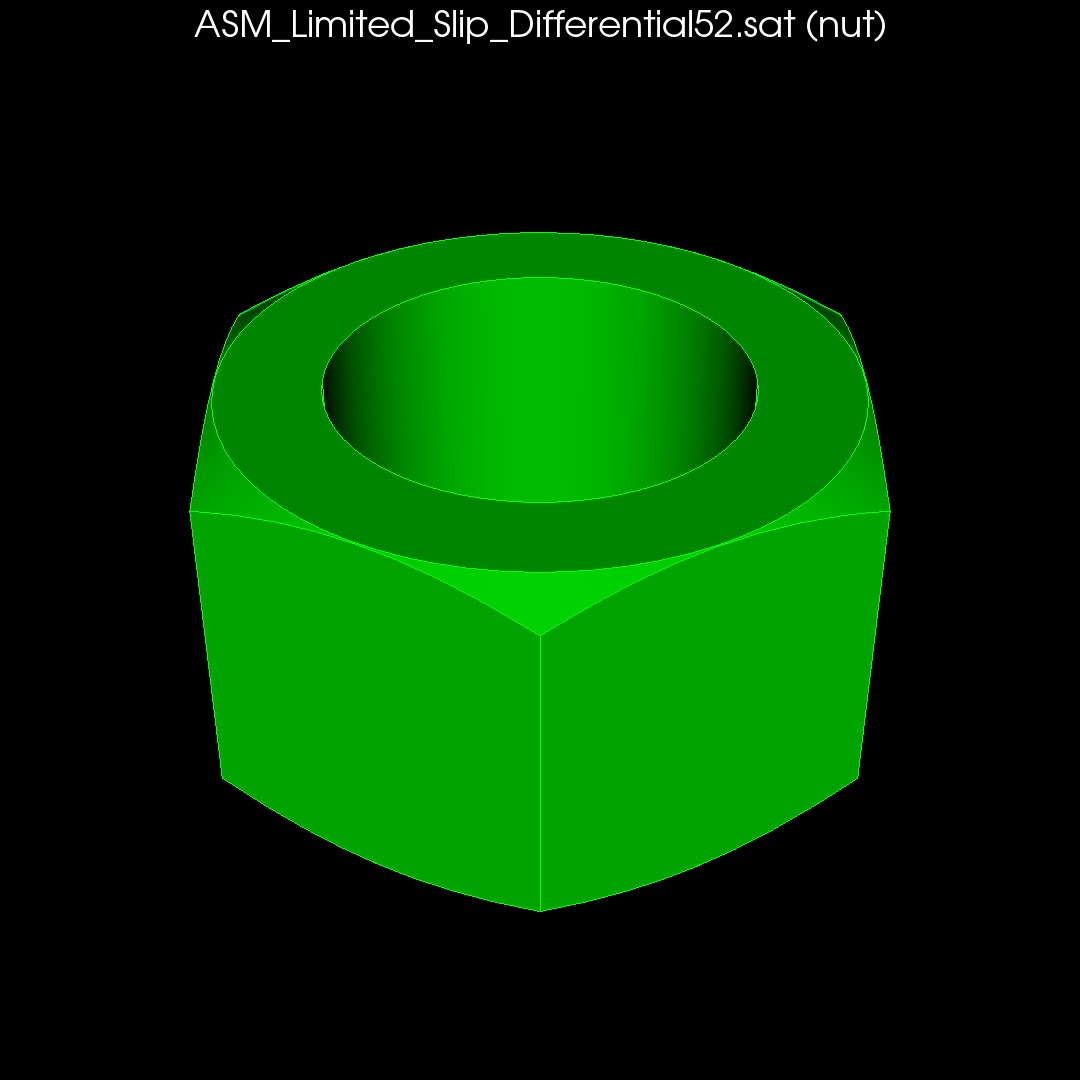
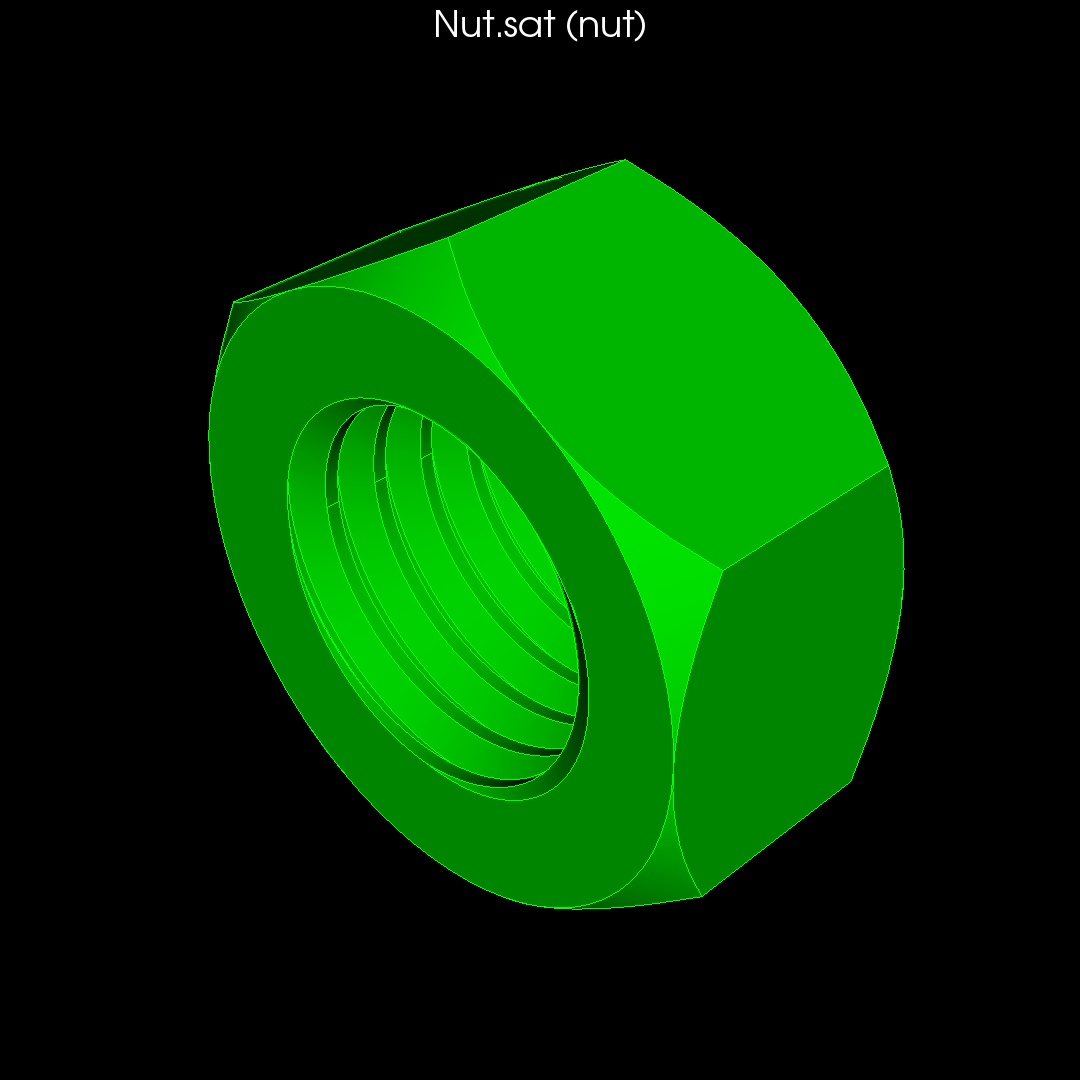
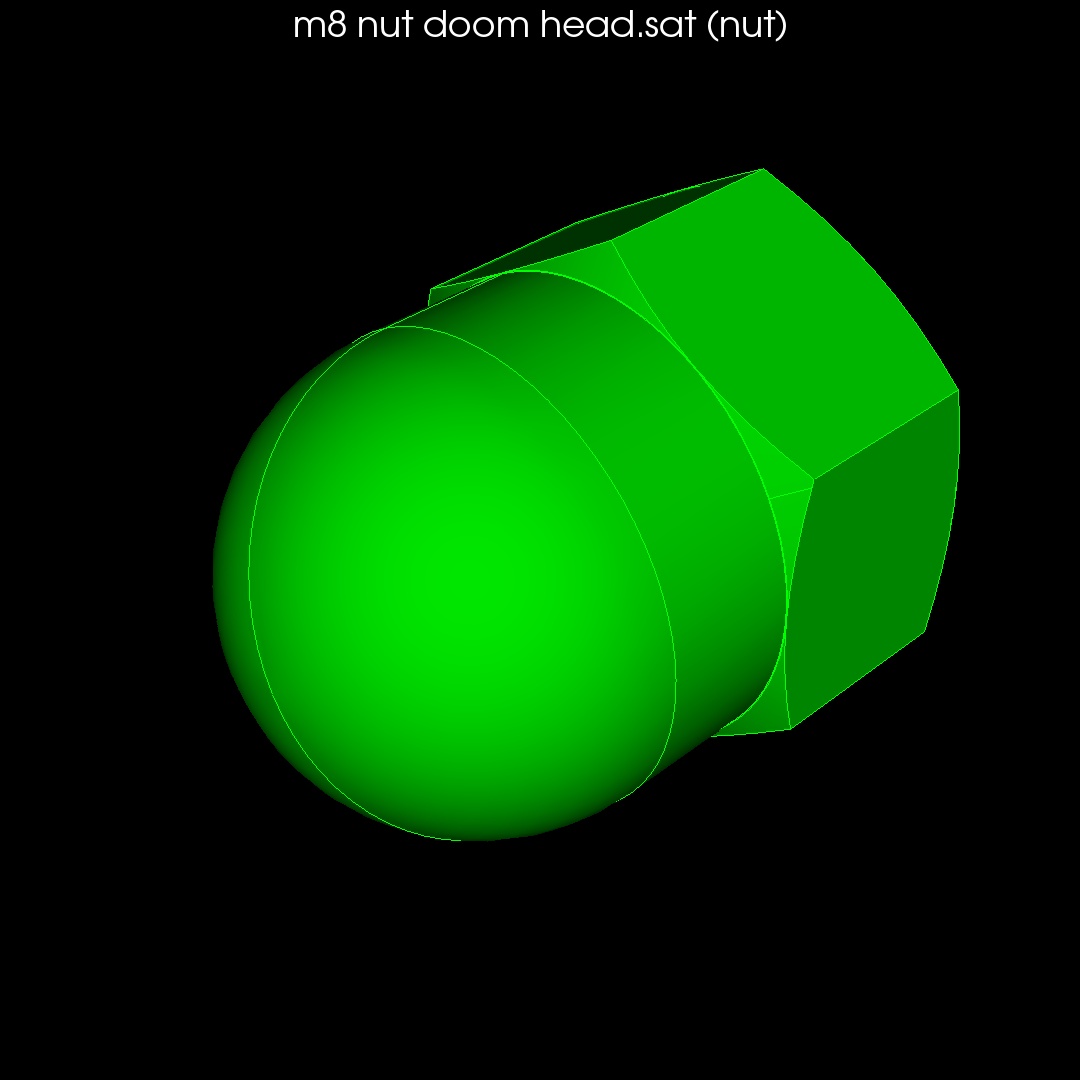
Nuts |
|
|
|
|
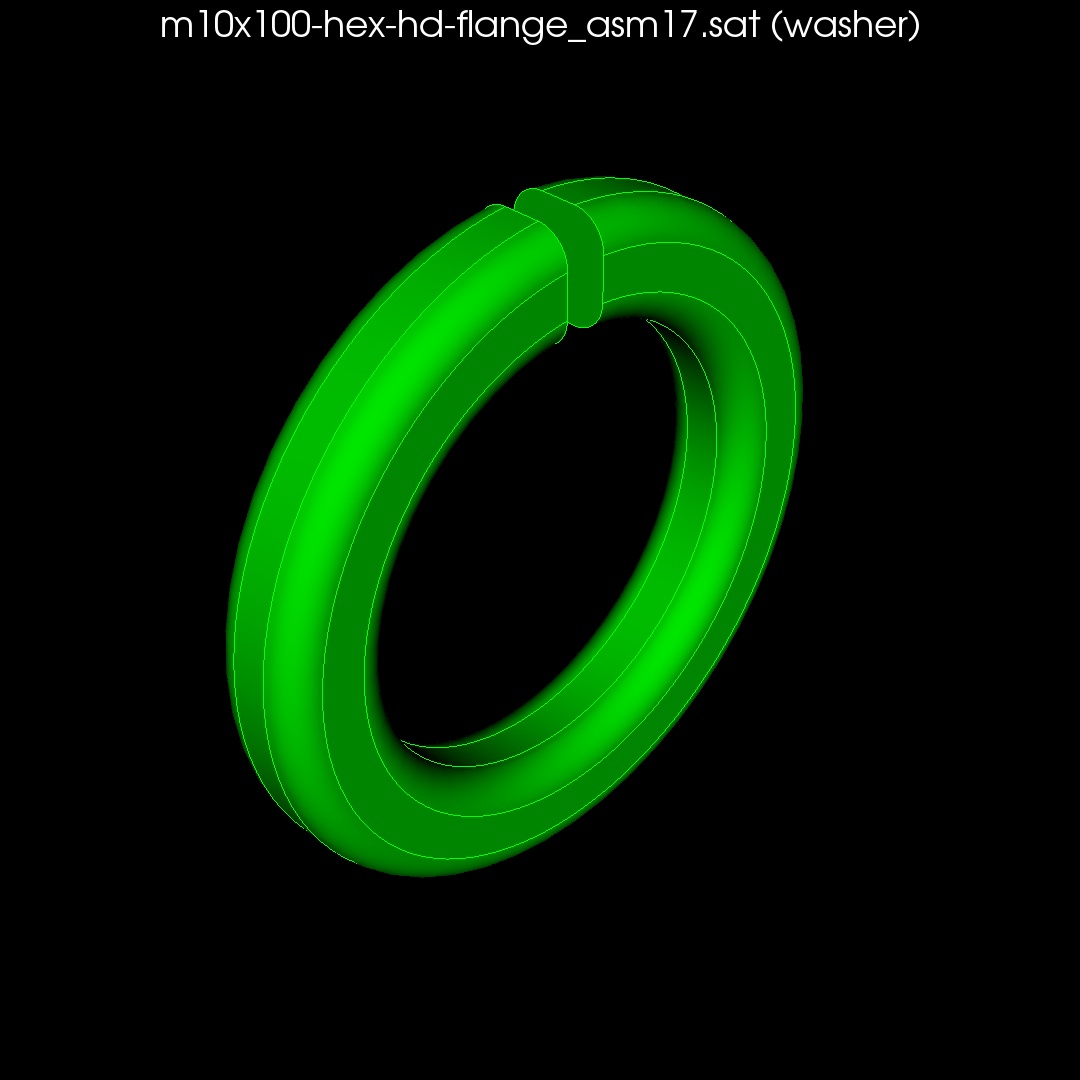
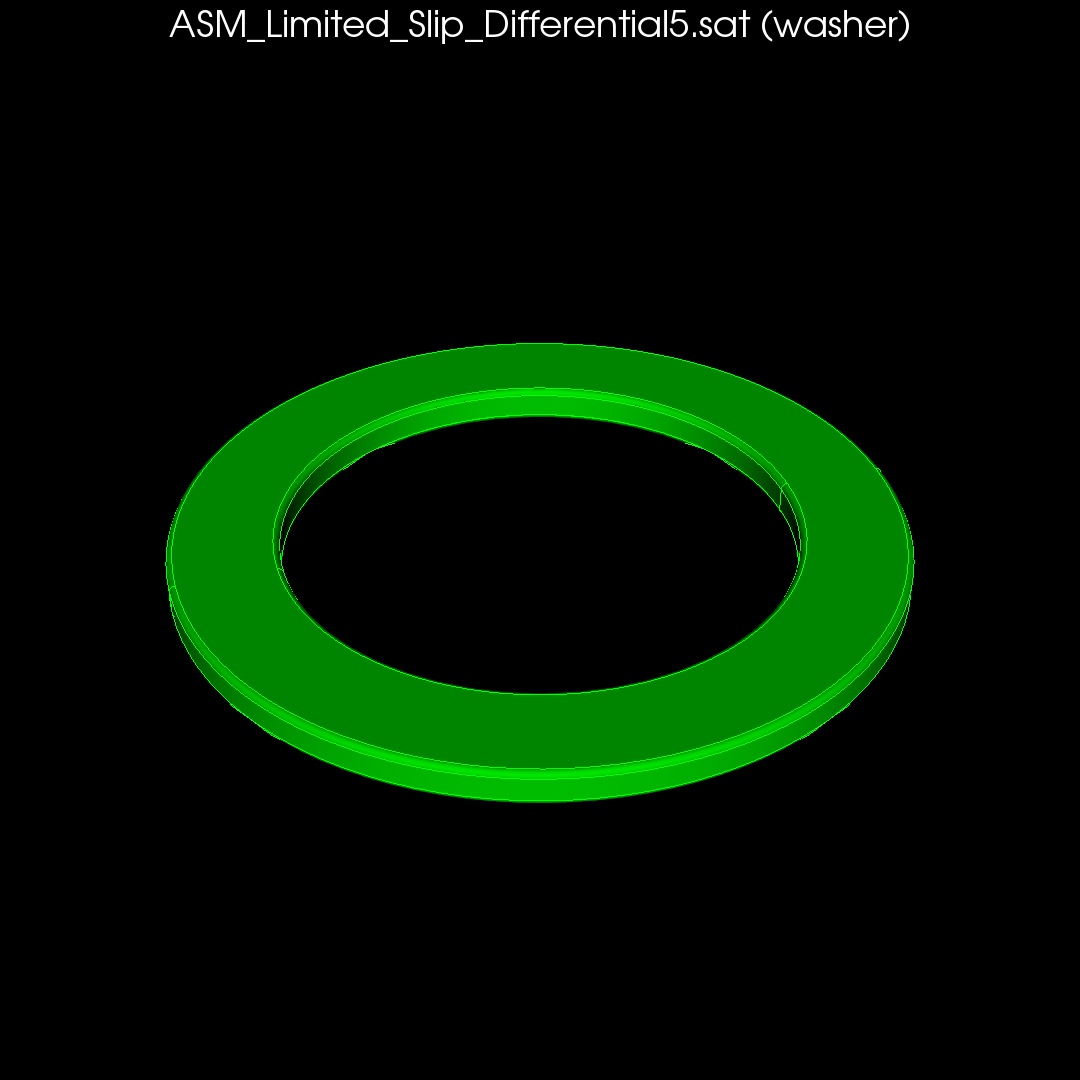
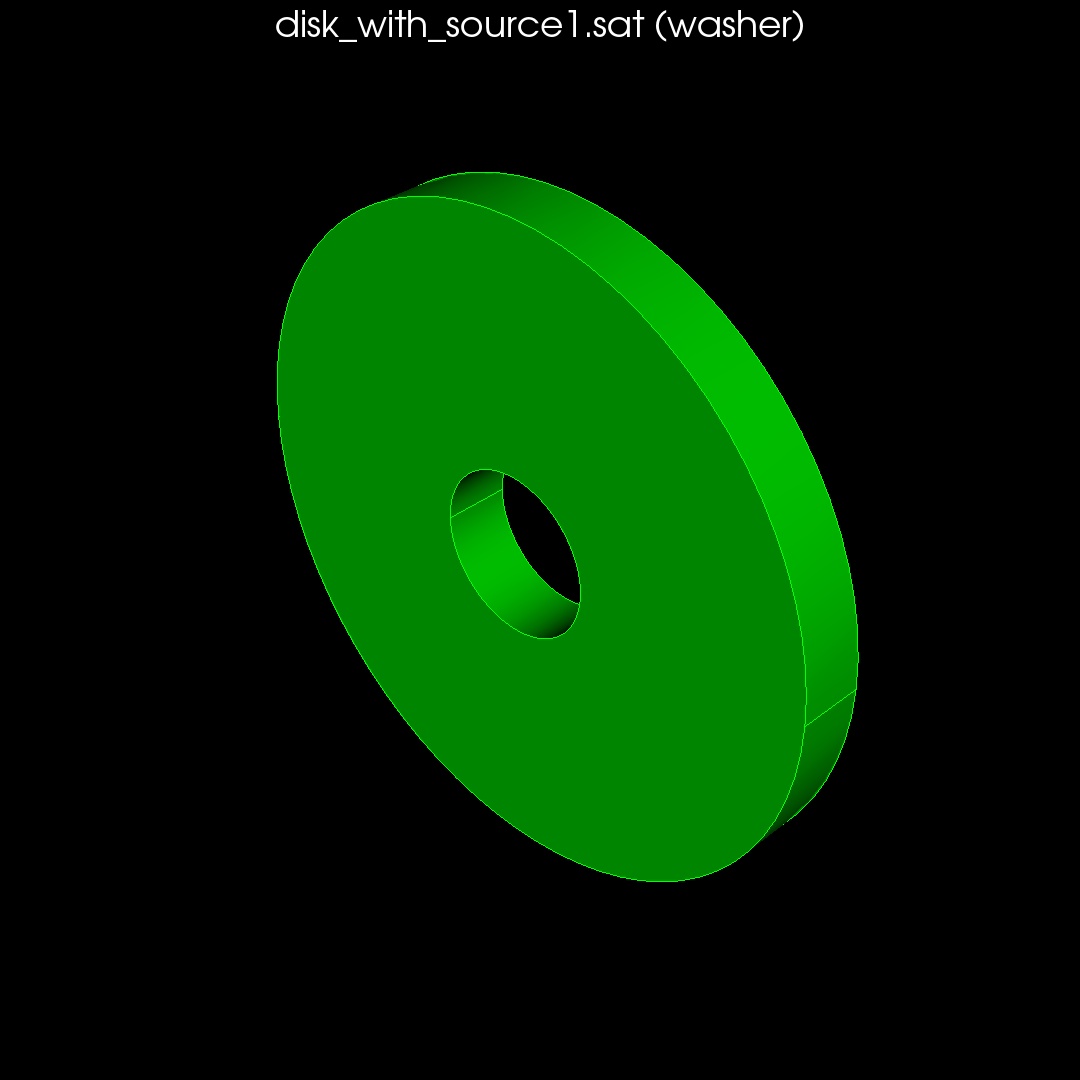
Washers |
|
|
|
|
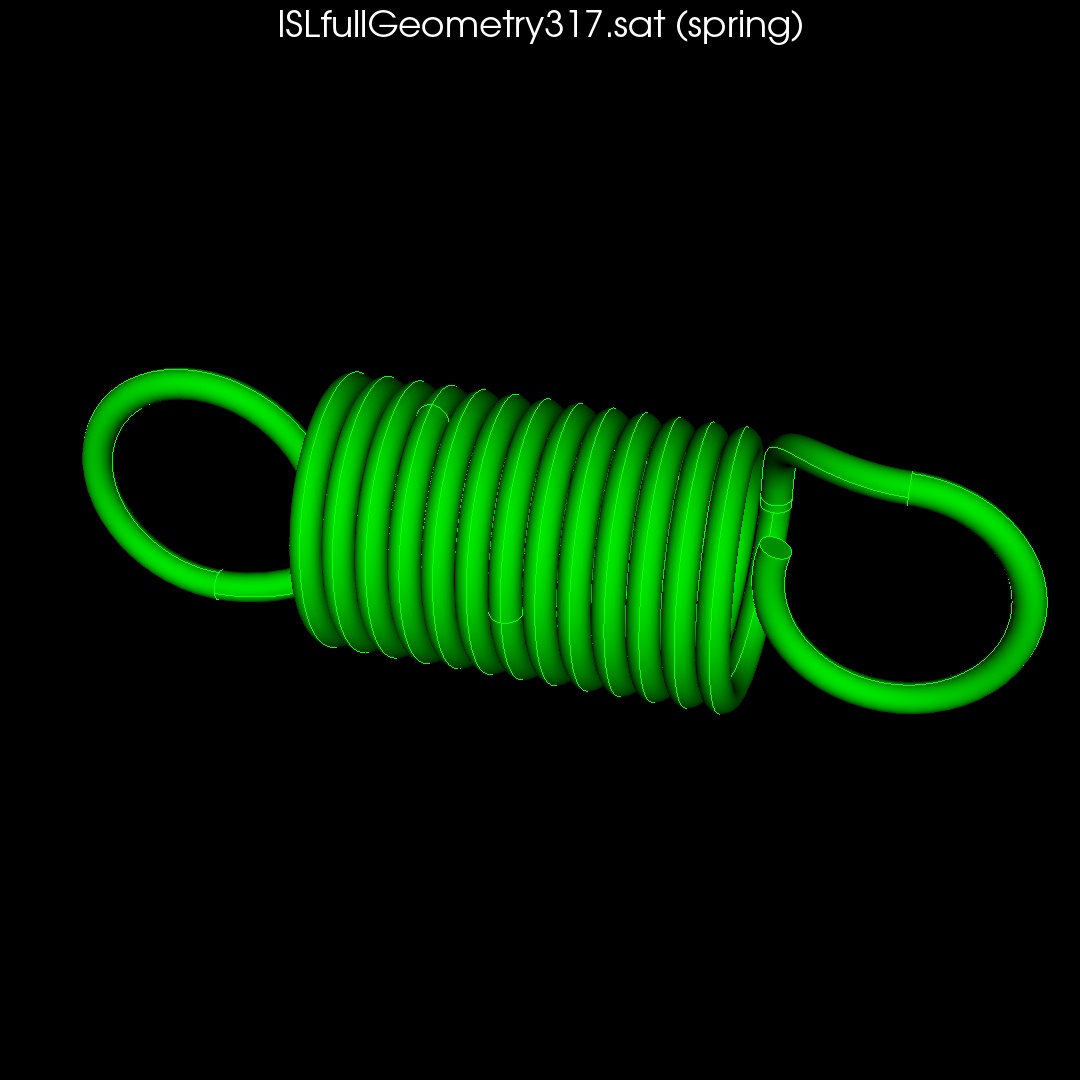
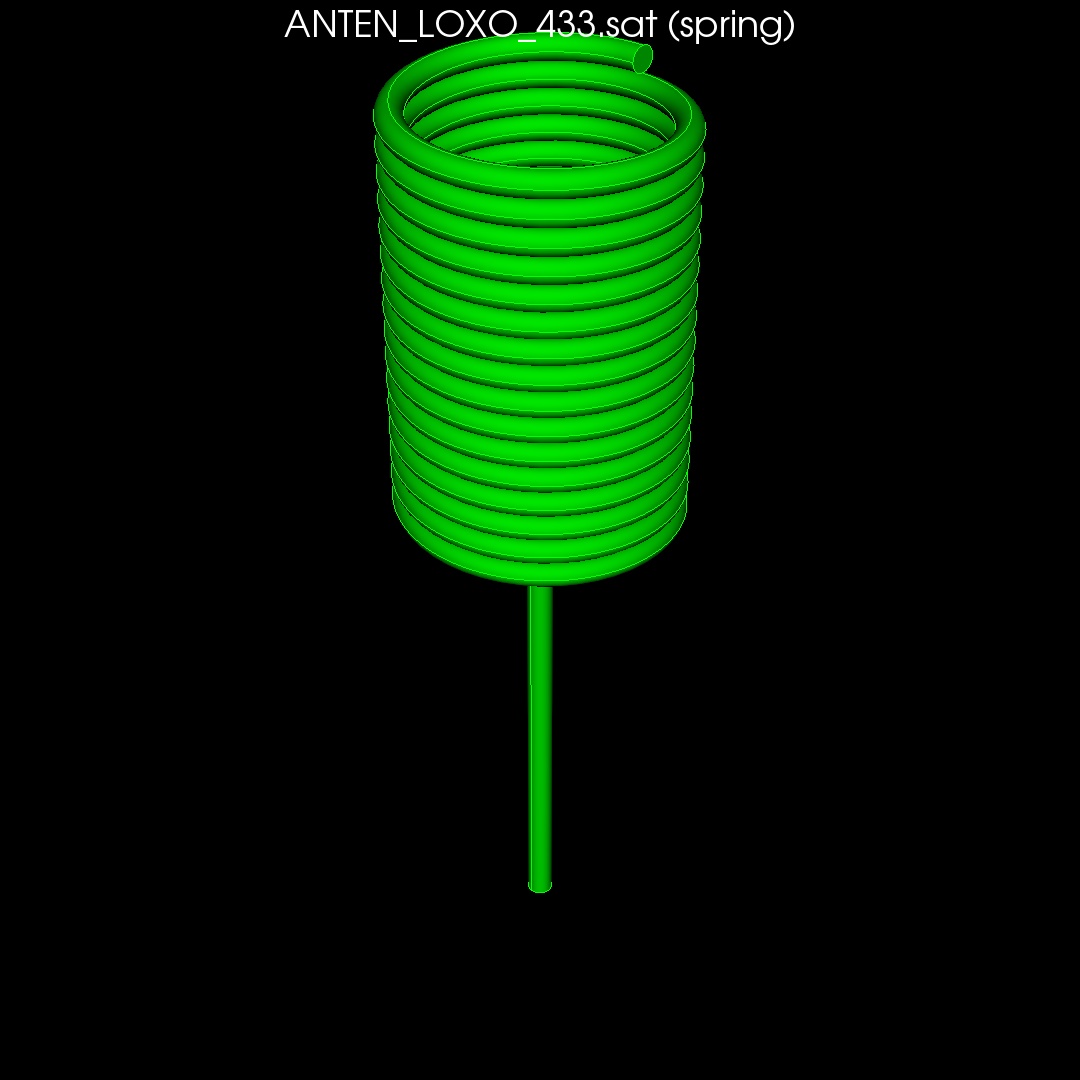
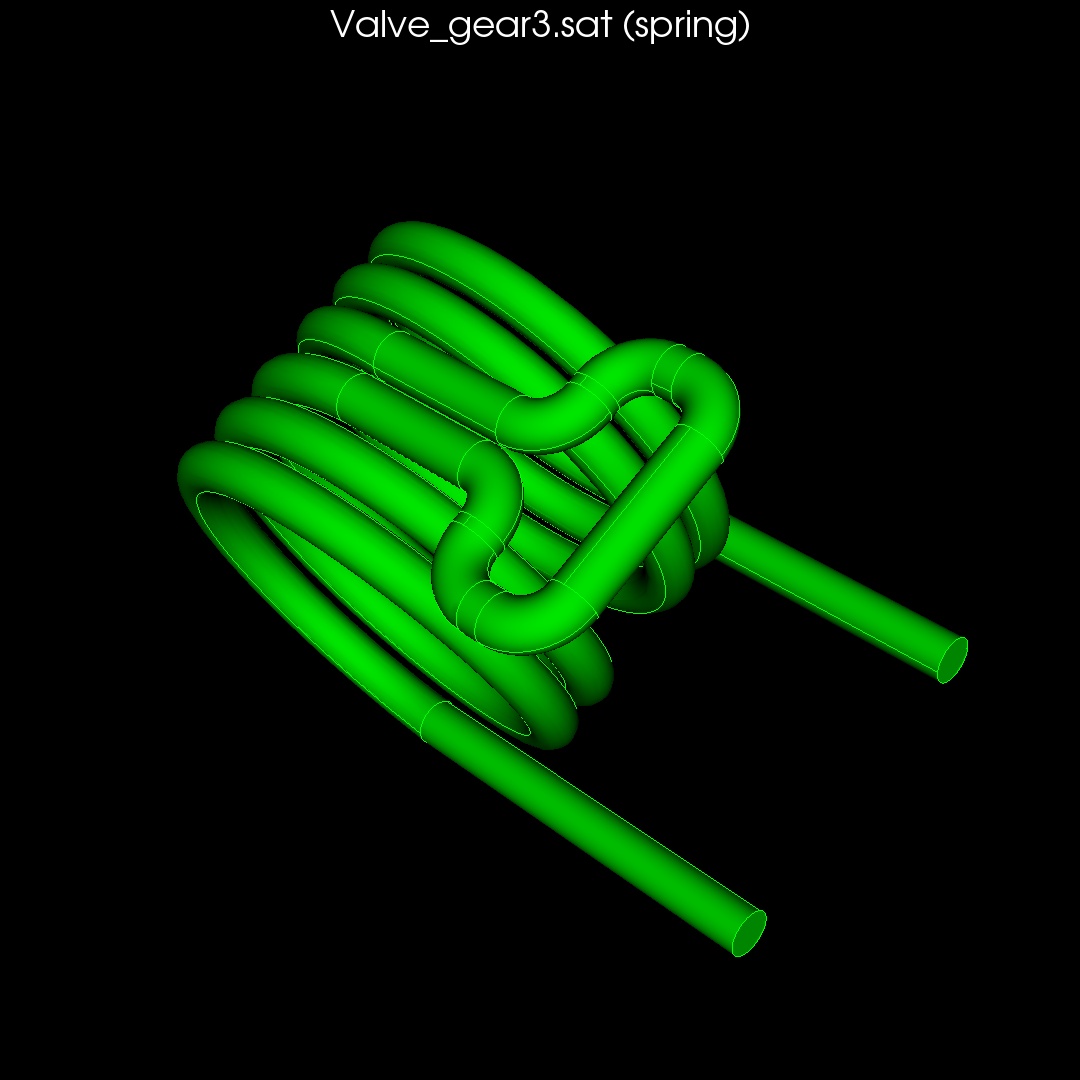
Springs |
|
|
|
|
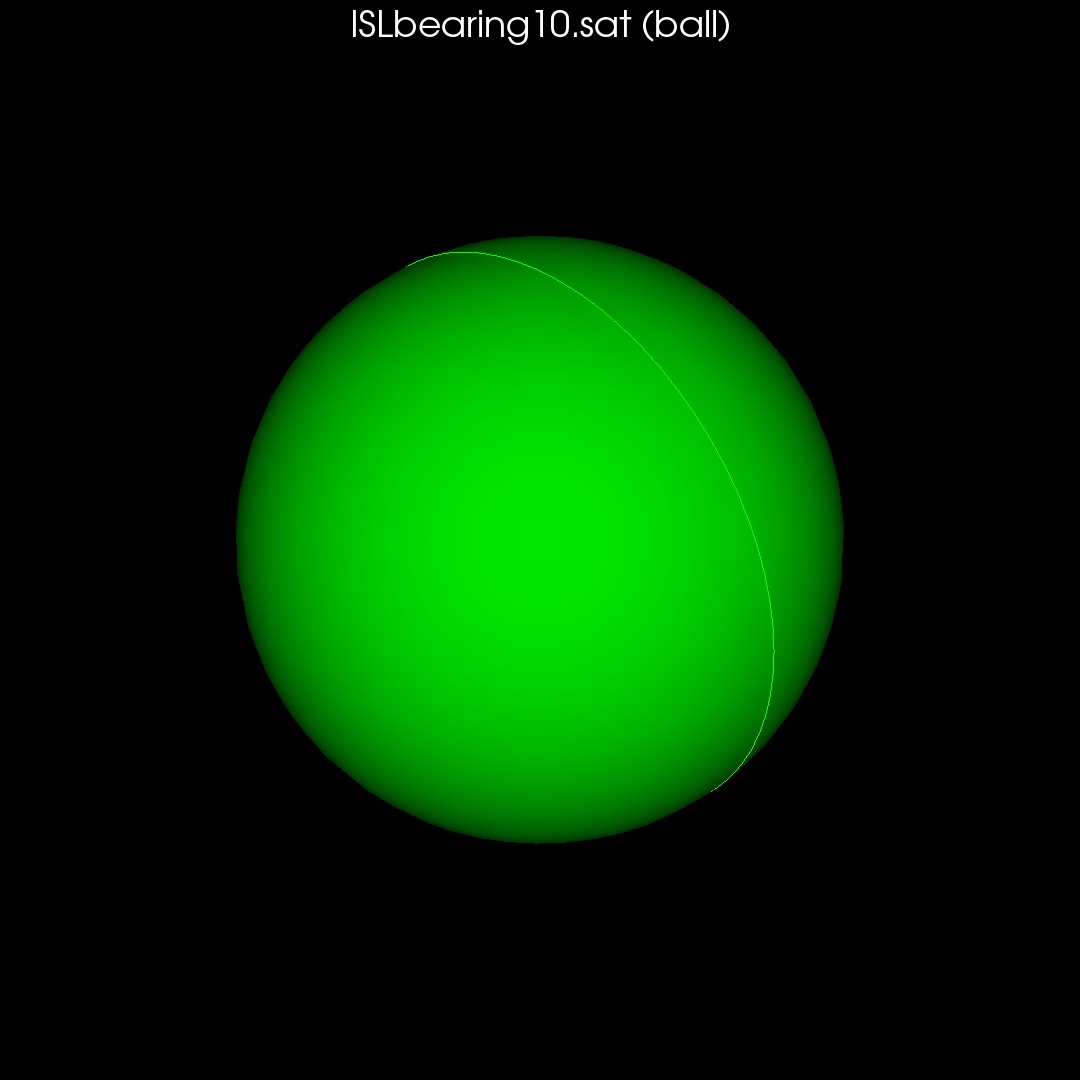
Balls |
|
||
|
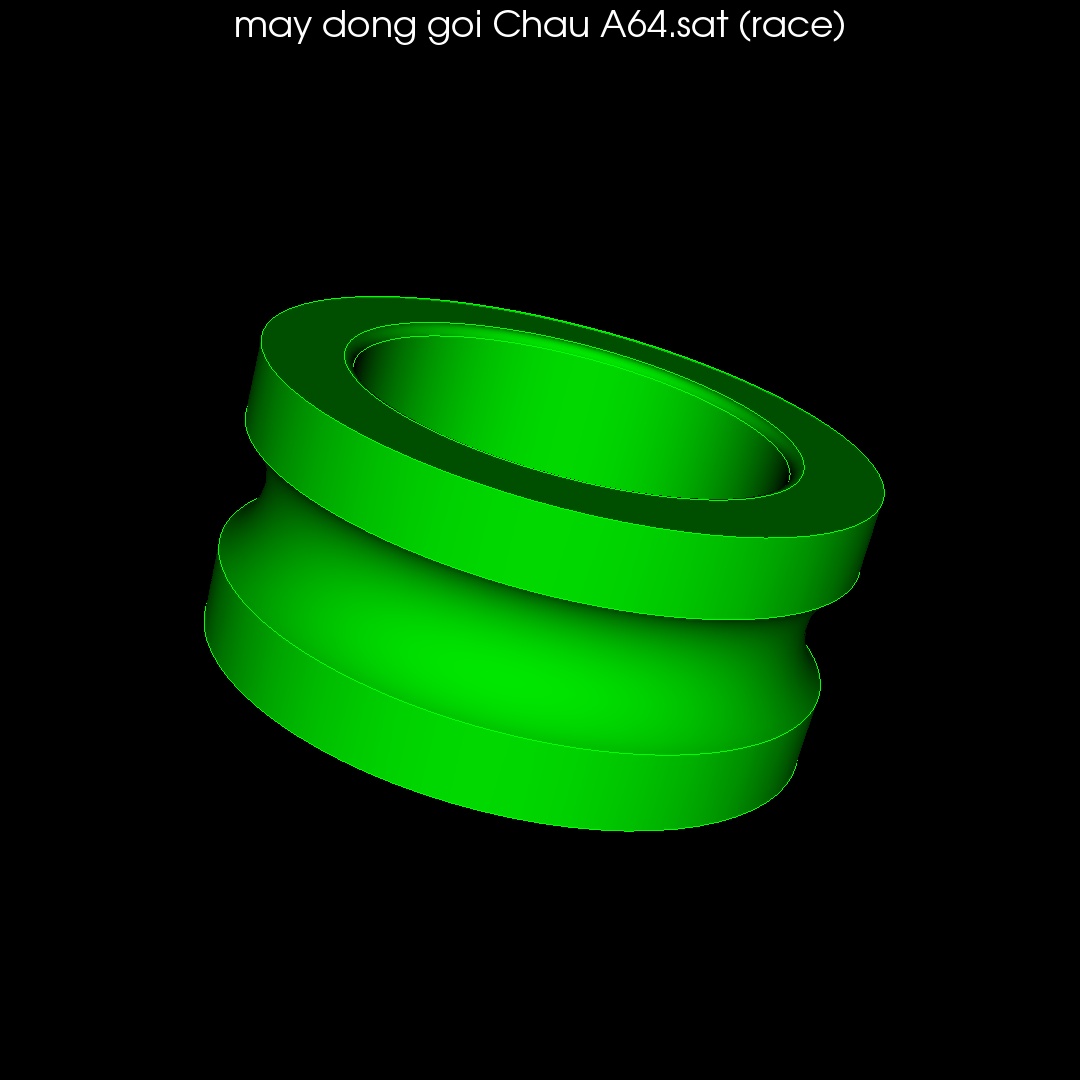
Bearing Races |
|
|
|
|
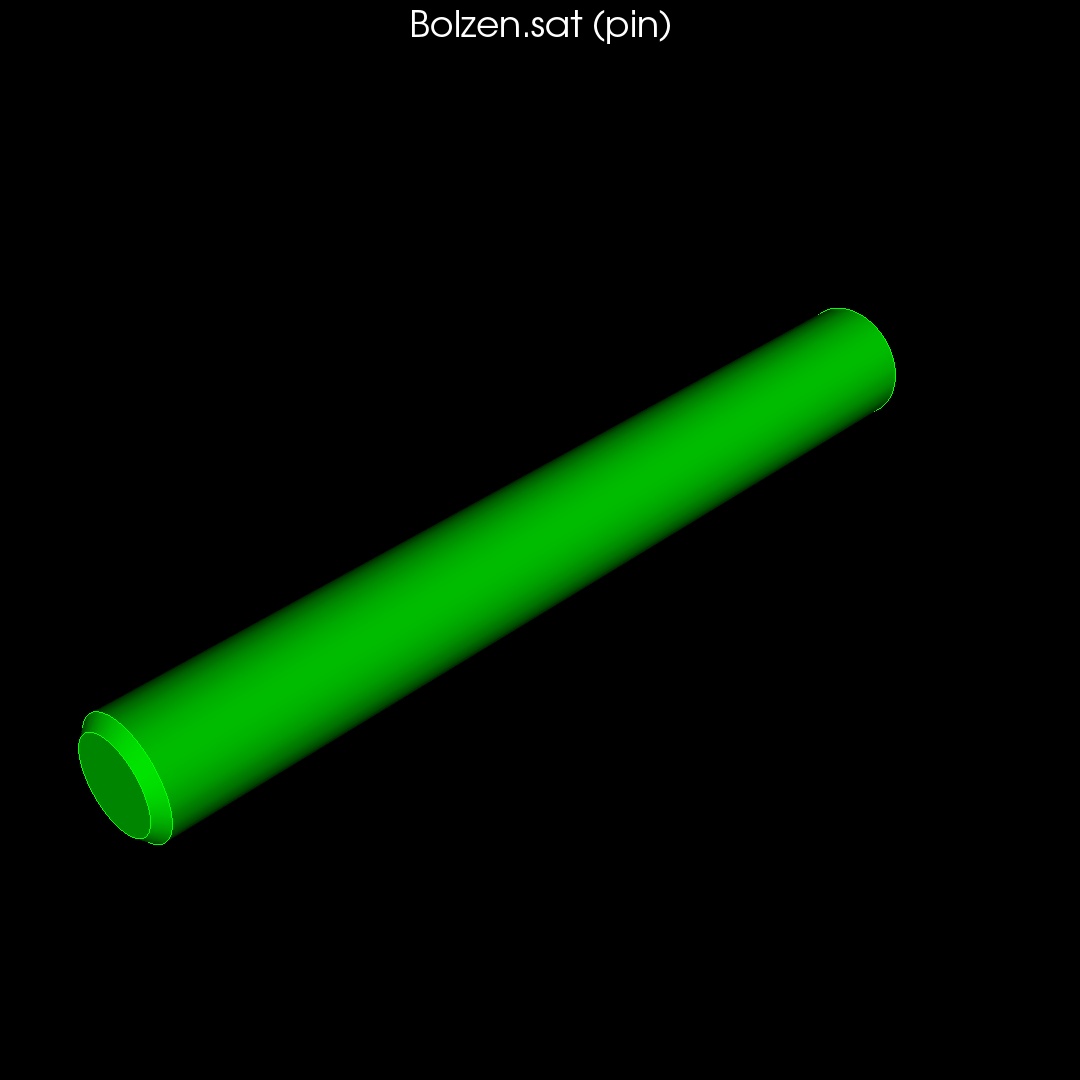
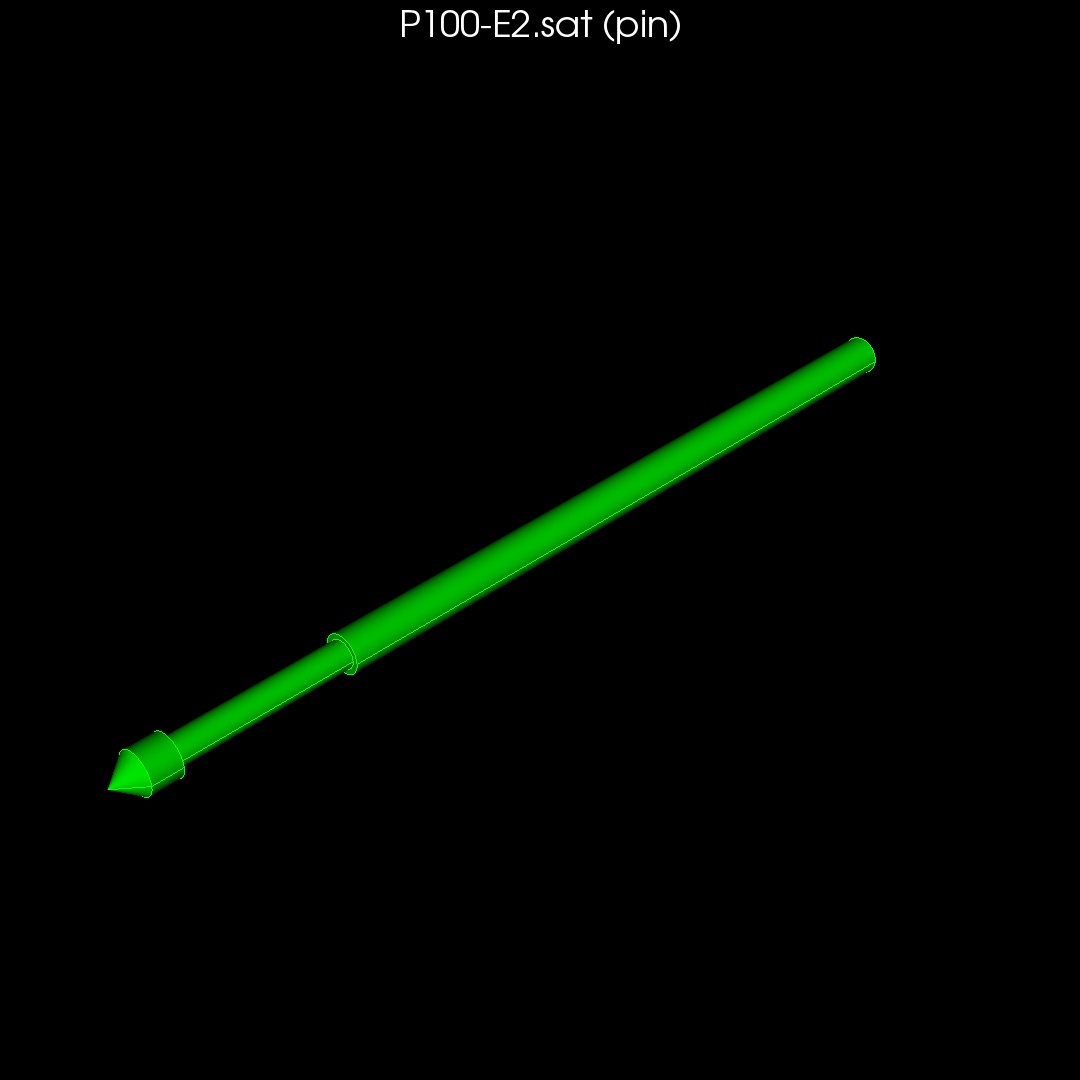
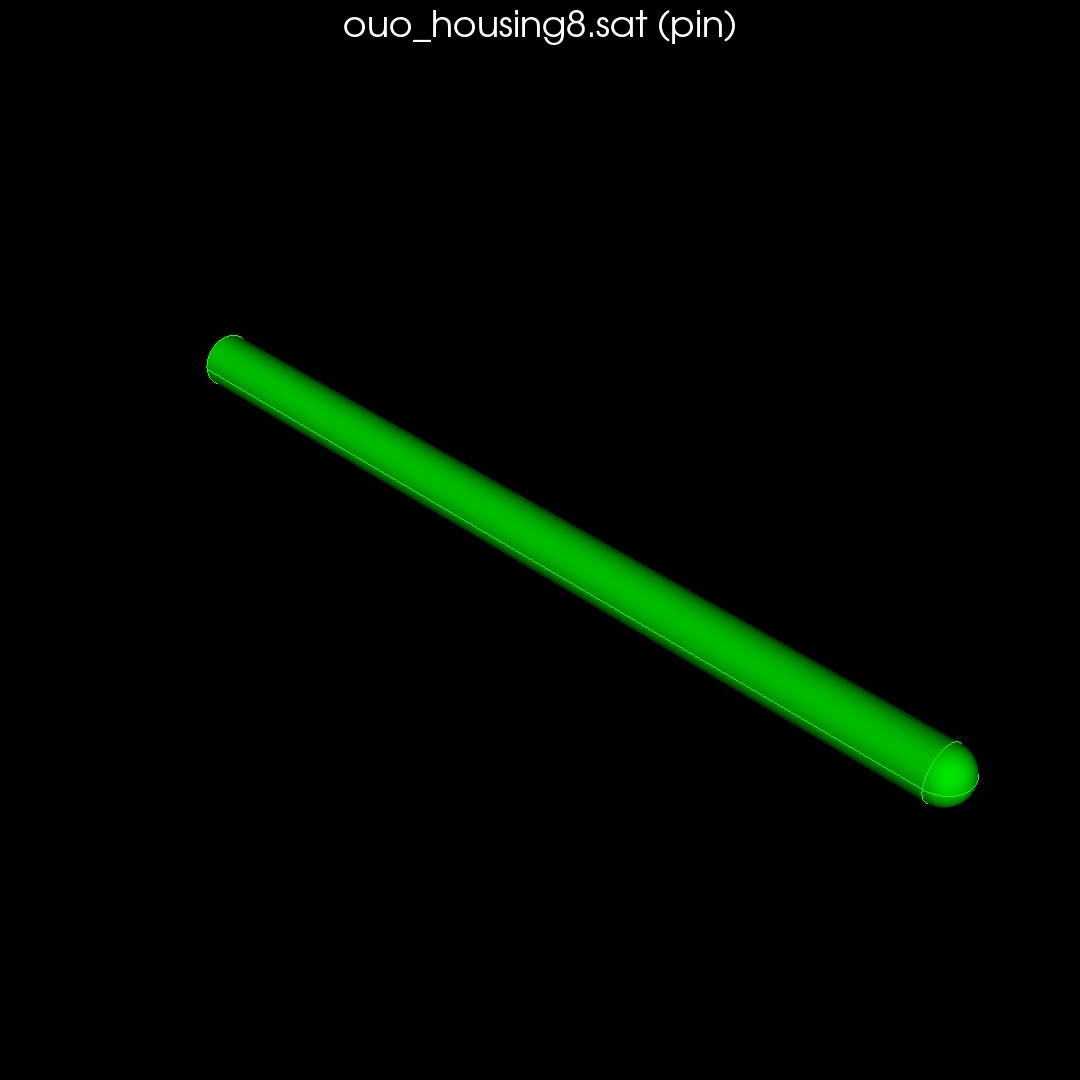
Pins |
|
|
|
|
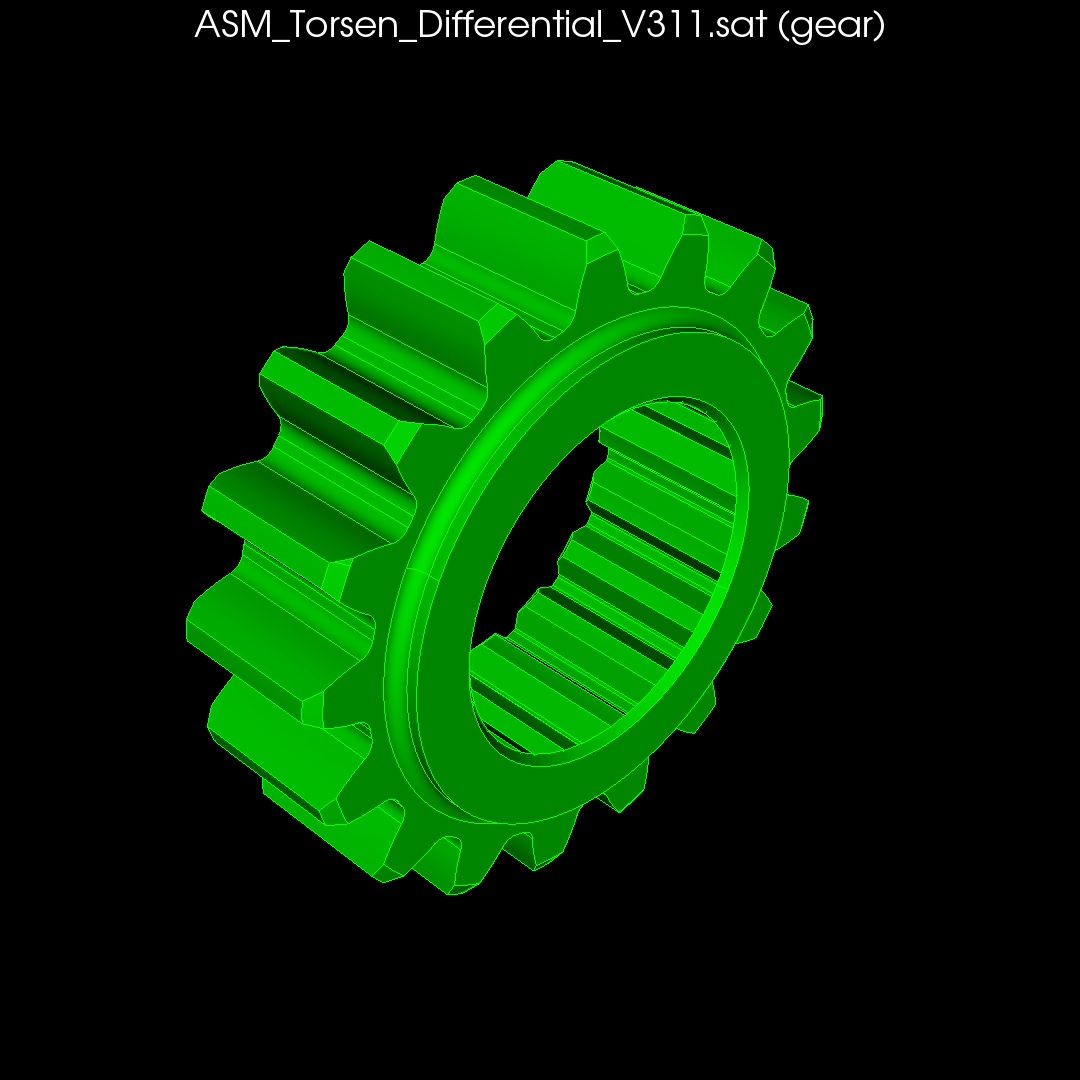
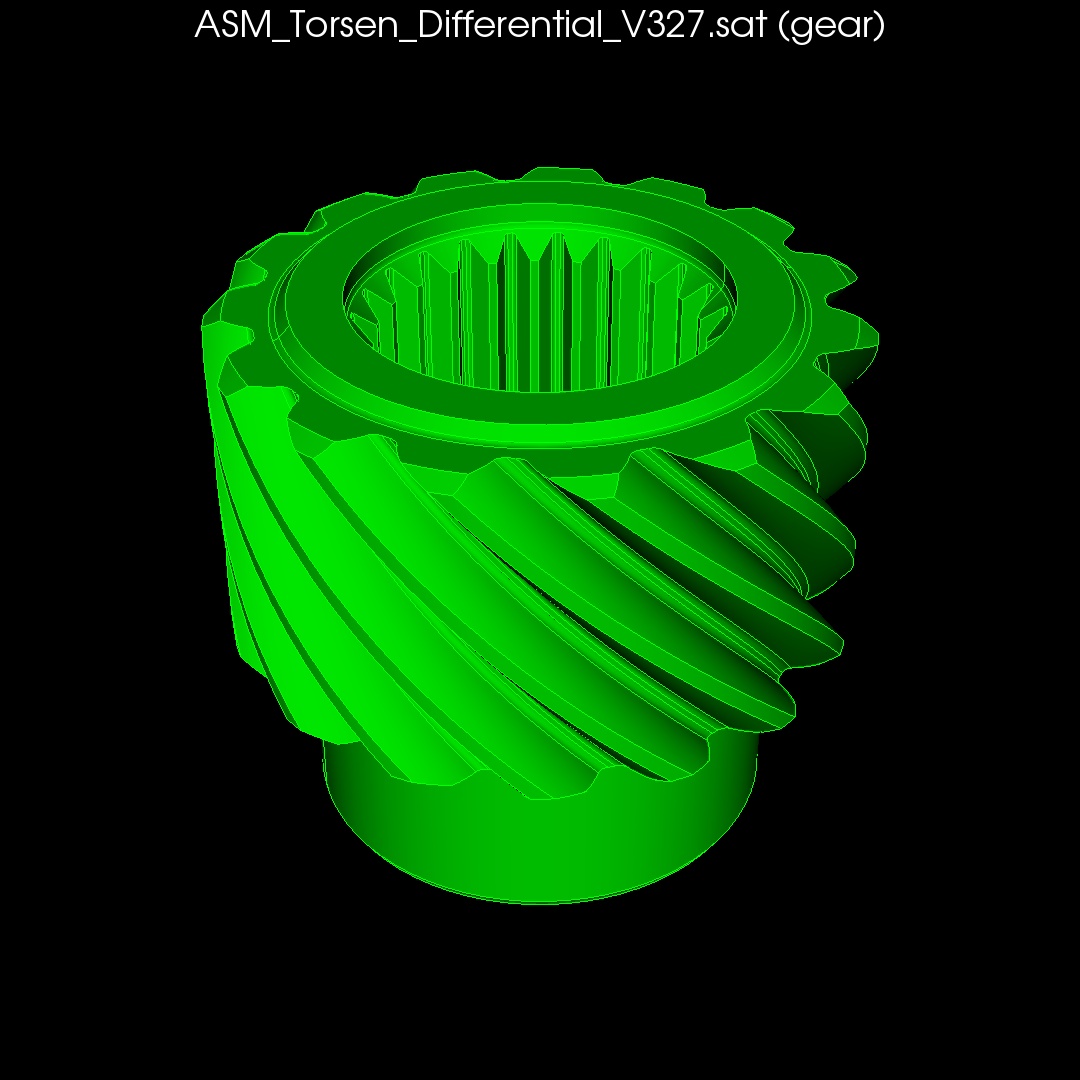
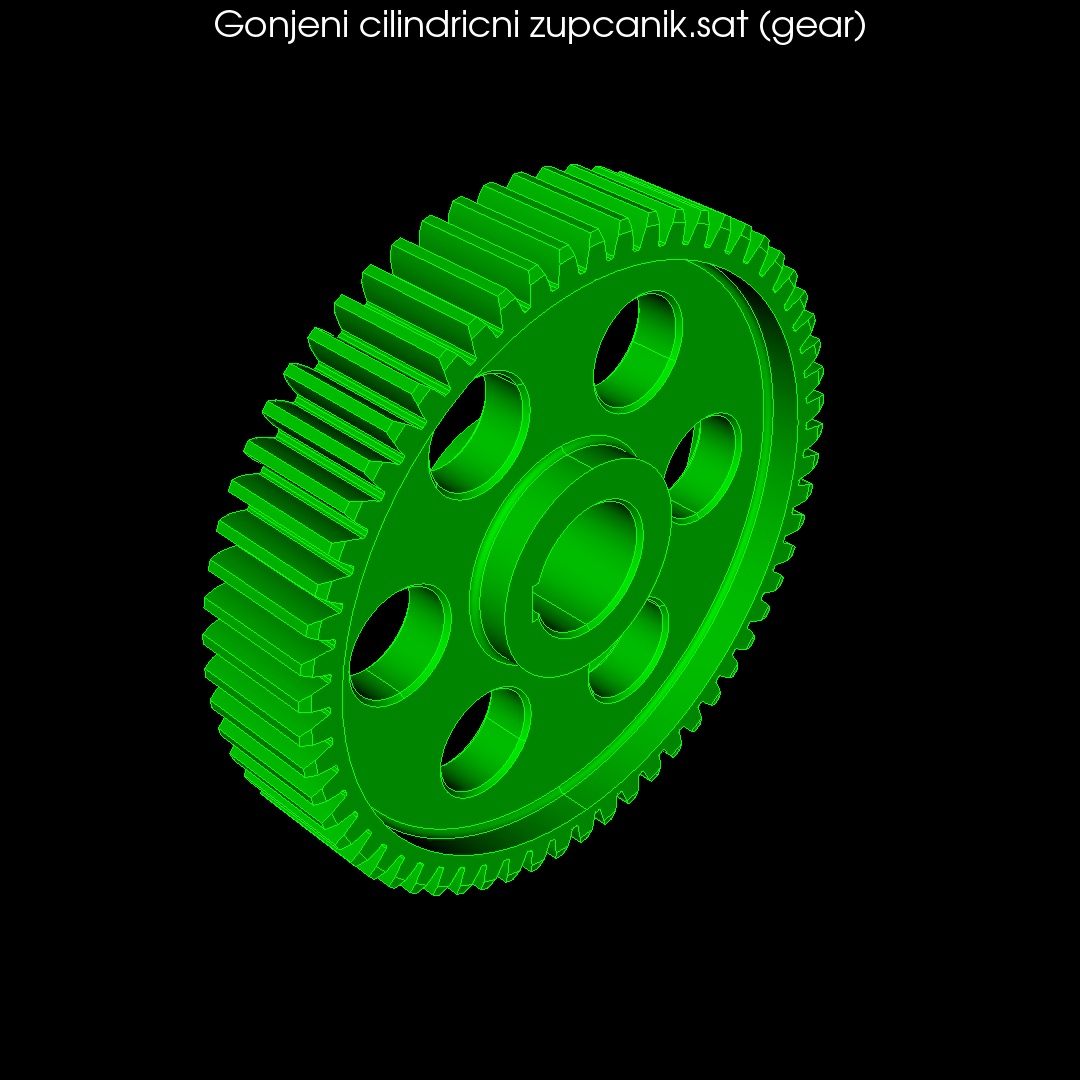
Gears |
|
|
|
|
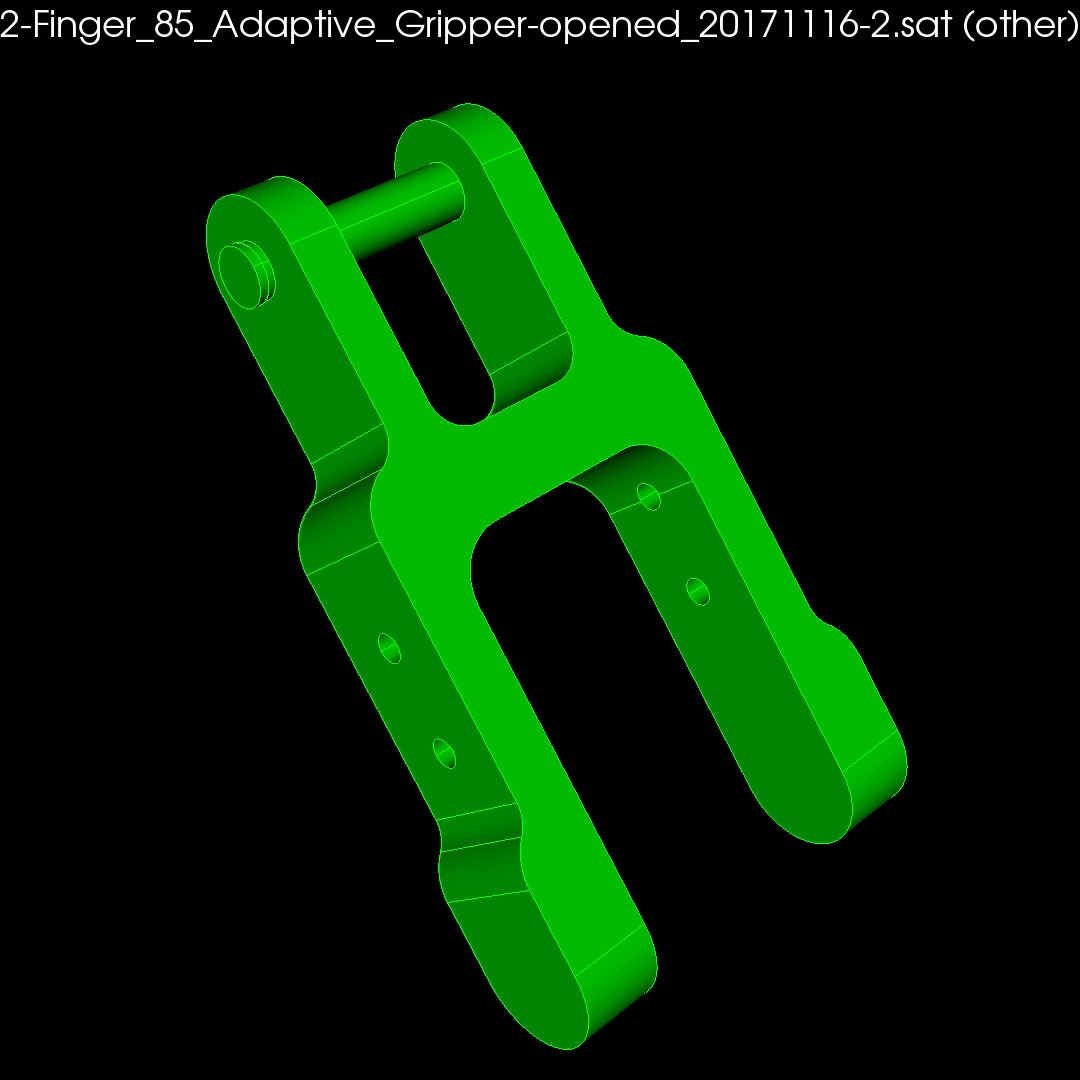
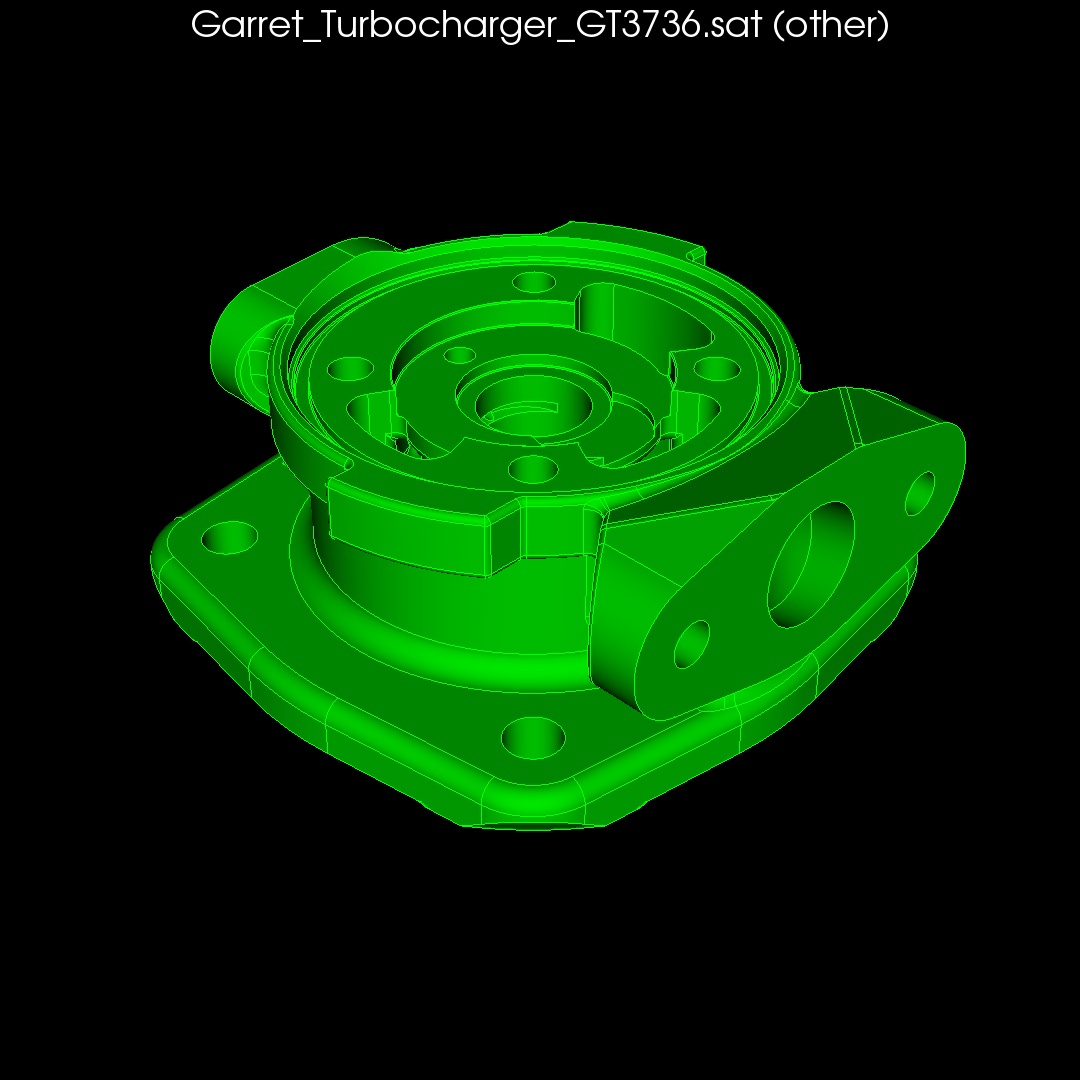
Other Parts |
|
|
|
Note that the Other Parts category simply includes parts that cannot be categorized with sufficient confidence in any of the other categories.
Context Menus: To display all volumes in a specific category, select the part category title and use the right click context menu and choose Draw. Expanding the list will display individual volumes that can be visualized using standard draw tools such as Zoom To, Fly In, Draw Overlapping Volumes, Draw Nearby Volumes, etc. The context menu also provides access to command panel options such as Delete or Reduce. When multiple volumes are selected, the context menu can be used to invoke command panels to operate on multiple volumes simultaneously.
To view the volume features or the confidence values computed by ML, use the right click context menu when a part/volume is selected and choose either List ML Features or List ML Predictions menu option.
Once entities have been identified, custom solutions may be displayed by checking the Show Solutions check box above the list of entities. When checked, the Solution window will appear as shown in Figure 4. When an entity is selected in the upper window, an ordered list of solutions will appear in the Solution window. Each solution has an associated metric prediction so that the solution predicted by ML to provide the best possible meshing result will appear at the top of the list.
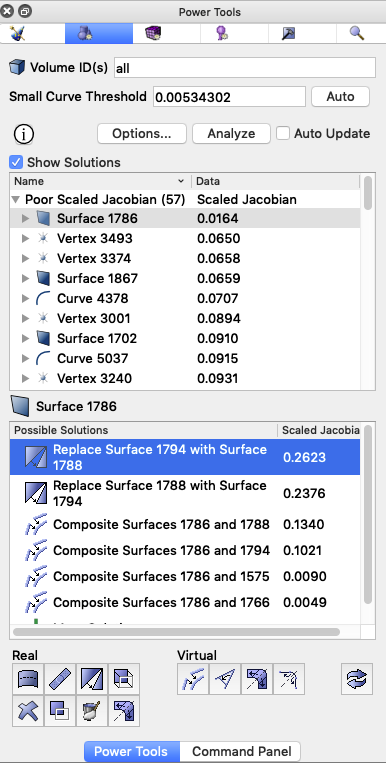
Figure 4. Geometry Power Tool showing Scaled Jacobian quality predictions as well as an ordered list of possible solutions.
For example, in Figure 4. Surface 1786 is selected which has a predicted minimum Scaled Jacobian metric at the surface of 0.0164. In most cases this metric would be unacceptable for analysis. To correct for this, the first solution in the list is a Replace Surface command that is predicted to result in a Scaled Jacobian of 0.2623. Selecting the solution will display a preview of the operation and double clicking will execute the solution. Other solutions may also be previewed and considered, however those with lower predictions would most likely be avoided.
Context Menus: A context menu is available when selecting a solution. This also provides an option for execution of the solution as well as additional visualization options. It also provides direct access to the appropriate command panel if further customization of the command is desired.
Controlling Solution Predictions: When selecting an entity from one of the metric categories (Scaled Jacobian, In-Radius, Deviation), the predicted value and ordering of the solutions will be based on the corresponding category. Note that solutions may also be generated for other diagnostics (ie. small curves, close loops, blend surfaces, etc.). When ML has been enabled, solutions will also be ordered these categories based upon the predicted tetmesh outcome. The metric used for ordering solutions can be customized using the Options panel shown in Figure 3. Use the Show Solution Predictions check box to toggle the use of ML-predictions to order solutions. When solution predictions are enabled, a drop-down selector will allow selection of one of the three metrics to prioritize solutions.
When selecting a volume from a classification category, selected solutions will also be displayed. Custom solutions based upon a specific part type are still in development and will expand in future versions of the geometry power tool.